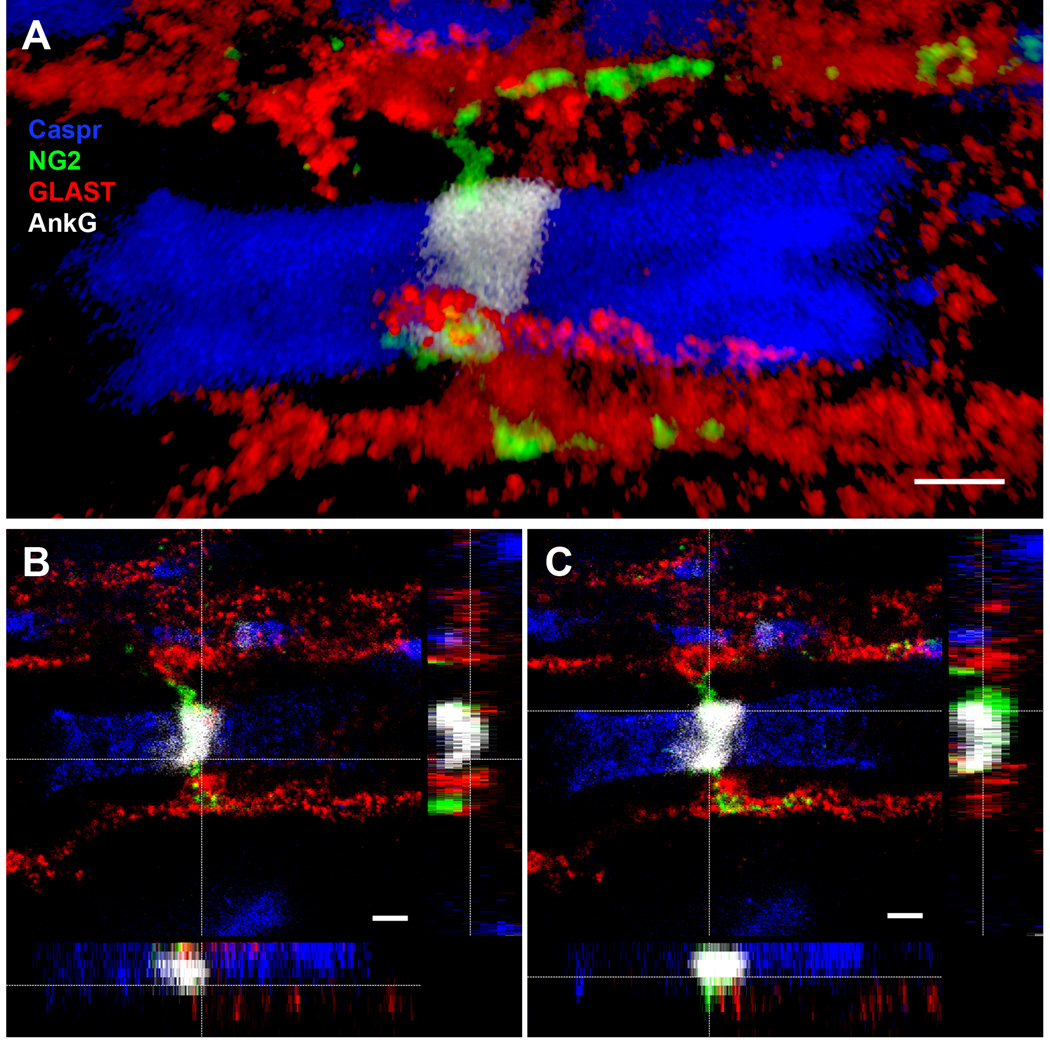
Figure 5.
Super resolution image of node of Ranvier in the mouse thoracic spinal cord. STED confocal images showing the close association of both astrocyte (GLAST, red) and NG2 cell (NG2, green) processes with the node (AnkG, white), flanked by paranodes (Caspr, blue). Scale bars, 1 µm.
A: 3D volume rendering of glial contact at the node.
B: Orthogonal views of the node, showing astrocyte (GLAST, red) contact at the node (AnkG, white).
C: Orthogonal views of the node, showing NG2 cell (NG2, green) contact at the node (AnkG, white). The NG2 cell process appeared to wrap closely around the node of Ranvier.

