Figure 7.
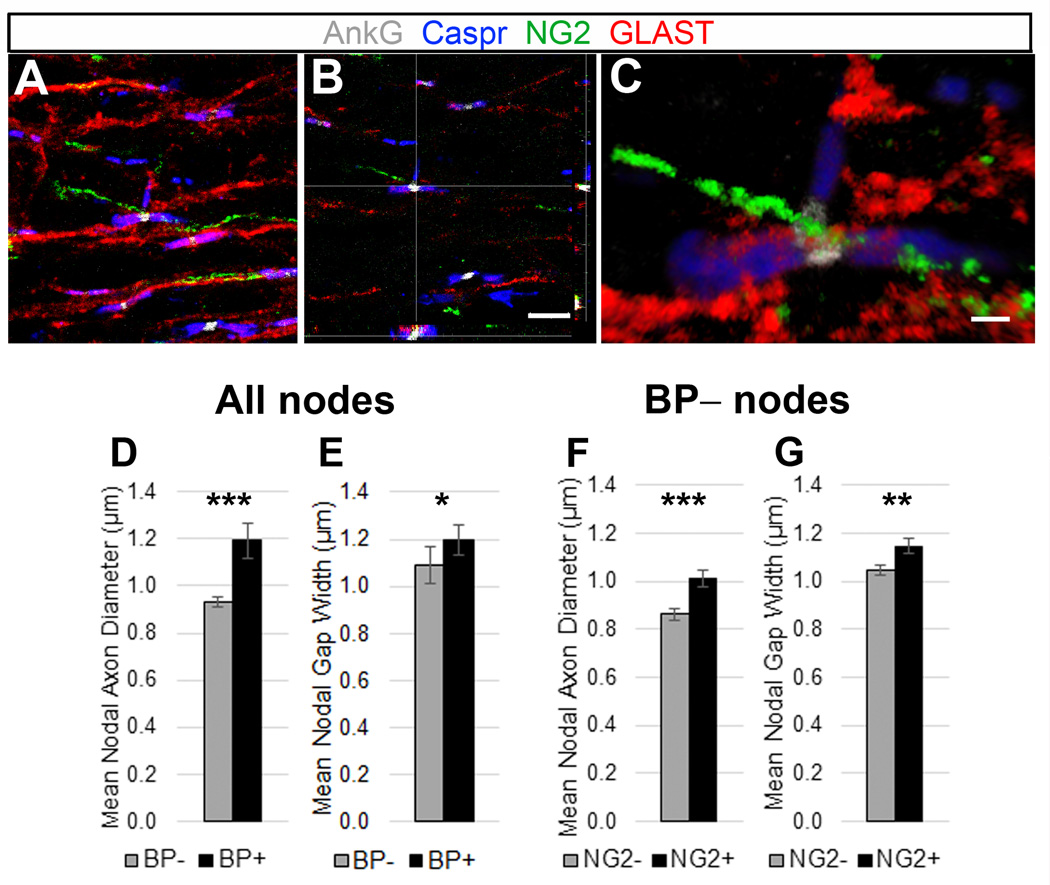
Quantification of nodes of Ranvier with axonal branchpoints in mouse thoracic ventral spinal cord white matter.
A–C: Quadruple immunostaining of P30 mouse spinal cord white matter sections labeled with AnkG (white), NG2 (green), GLAST (red), and Caspr (blue) antibodies. GLAST+ (astrocyte) and NG2+ cell processes contact the AnkG+ nodes, flanked by Caspr+ paranodes.
A: Confocal maximum projection of z-stack images, with an arrow indicating a node with a branchpoint leading to a third Caspr+ paranode. Scale bar, 5 µm.
B: Orthogonal views of the branchpoint node indicated in (A), showing astrocyte (GLAST, red) and NG2 cell (NG2, green) contact at the node (AnkG, white). Scale bar, 5 µm.
C: 3D volume rendering of the branchpoint node indicated in (A). Scale bar, 1 µm.
D, E: Differences in the mean nAD (D) and nGW (E) of all the nodes with or without an axonal branchpoint.
F, G: The mean nAD (F) and nGW (G) of nodes without branchpoints that had or did not have an NG2 cell process.
Mean ± SEM; ***, p < 0.001; **, p < 0.01; *, p < 0.05.

