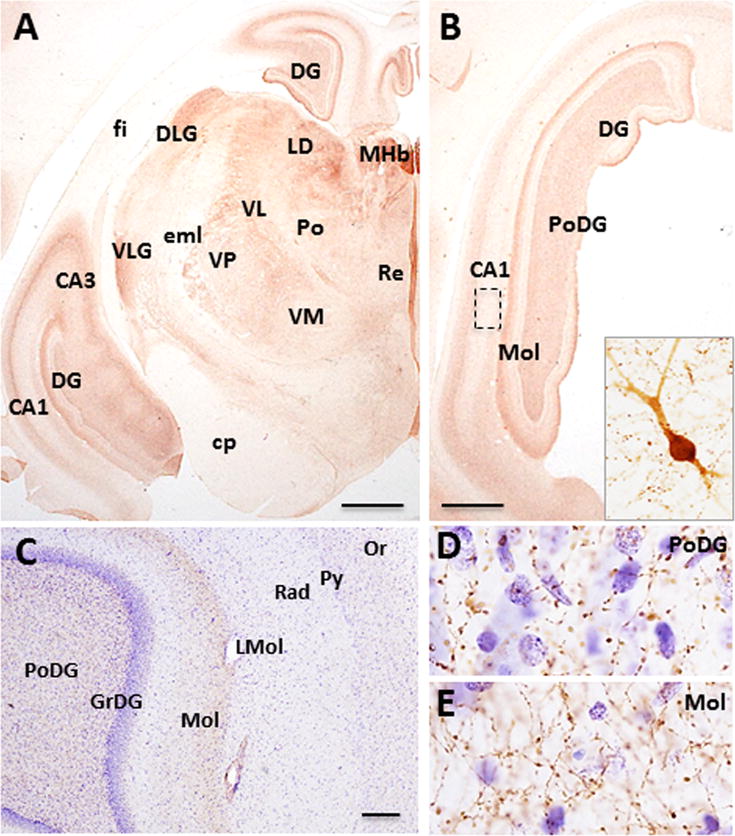
Figure 5.

Photomicrographs showing the distribution of ChAT-ir profiles in the hippocampus and thalamus of Sus scrofa domesticus. Coronal sections (A, B) showing ChAT-ir labeling in the dorsal and temporal aspects of the hippocampal formation and dentate gyrus (DG) and thalamic nuclei. Insert in B shows a cholinergic bipolar hippocampal neuron. Low (C) and high power (D, E) photomicrographs of a Nissl counterstained section showing ChAT-ir fibers within the polymorphic (C, D) and molecular layer (C, E) of the dentate gyrus. Scale 1000 μm A, B; 100 μm C.
