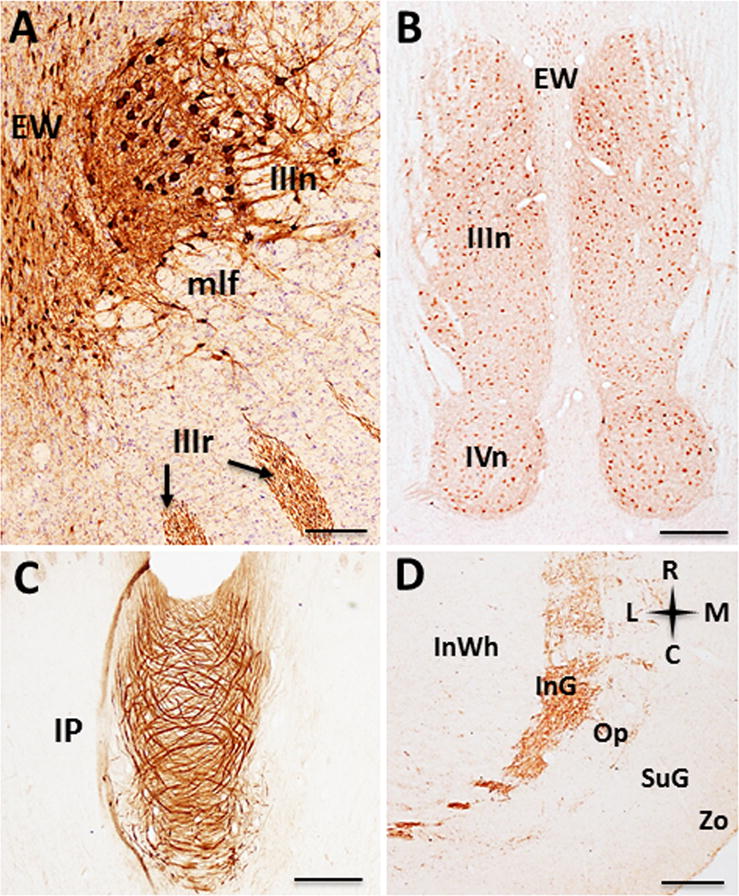
Figure 7.

Photomicrographs of ChAT-ir profiles in the mesencephalon. Coronal section showing ChAT-ir neurons within the Edinger-Westphal (EW) and oculomotor nuclei and third cranial nerve rootlets (black arrows) (A). Low-power photomicrograph of a horizontal section showing the Edinger-Westphal, third (IIIn) and fourth (IVn) cranial nerve nuclei (B). Horizontal section showing swirling ChAT-ir fibers in the central portion of the interpeduncular nucleus (IP, C). Low-power photomicrograph (D) of ChAT-ir fibers within the superficial laminae of the superior colliculus. Scale: 250 μm A; 1000 μm B; 500 μm C, D. Anatomic orientation: R= rostral, C= caudal, L= lateral, M= medial.
