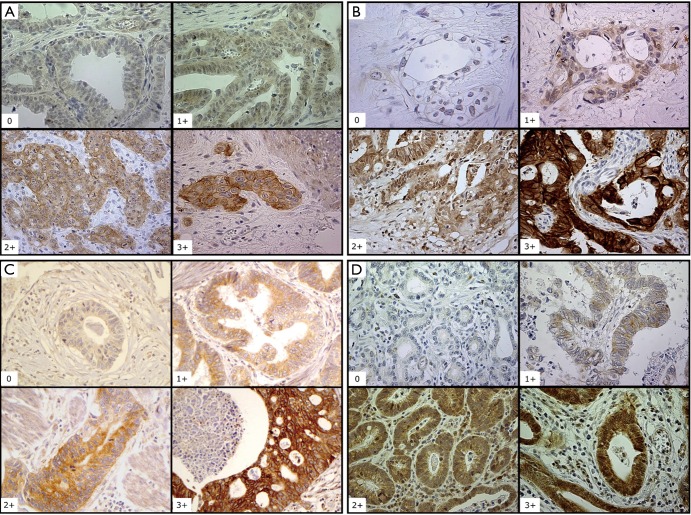
Figure 1.
Immunohistochemistry analysis and expression of EGFR, HER2, HER3, HER4 in esophagogastric adenocarcinoma (EGA). (A) EGFR, epidermal growth factor receptor staining (100×); (B) HER2, human epidermal growth factor receptor-2 (100× and 400×); (C) HER3, human epidermal growth factor receptor-3 (100×); (D) HER4, human epidermal growth factor receptor-4 (100×); Staining: 0, negative; 1+, weak; 2+, moderate; 3+, strong positivity. The first two photos in (B) (0 and 1+) are 400×, the second two (2+ and 3+) are 100×.

