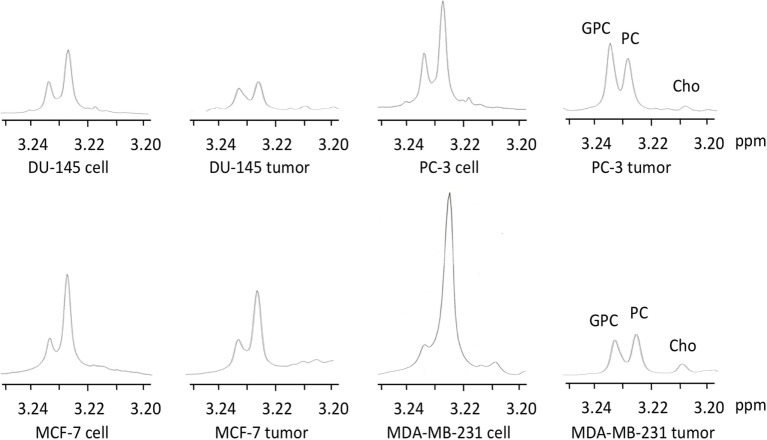
Figure 2.
Representative choline metabolite regions of 1H MR spectra obtained from water-soluble extracts of DU-145, PC-3, MCF-7, and MDA-MB-231 cells and the corresponding tumor xenografts. Spectra are expanded to display signals from 3.20 to 3.25 ppm. Peak assignments are: free Cho at ~3.208 ppm, PC at ~3.226 ppm, and GPC at ~3.235 ppm.

