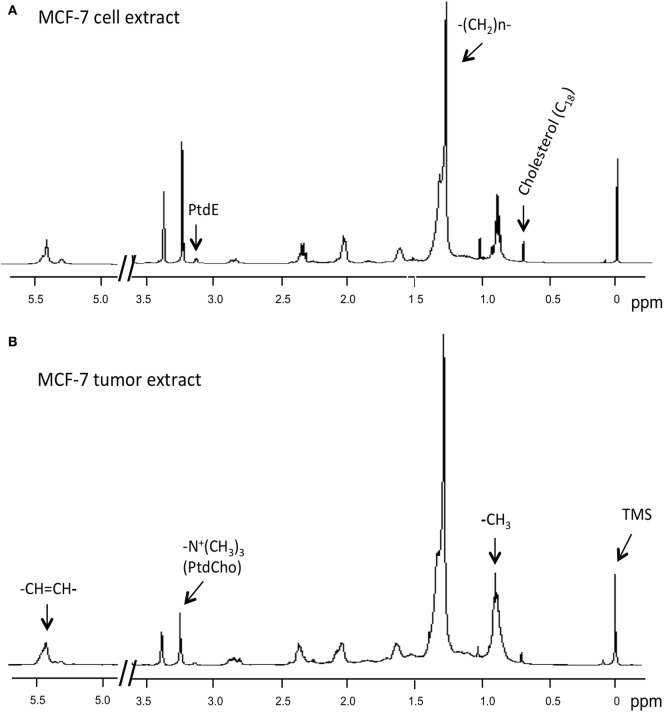
Figure 4.
Representative 1H MR spectra obtained from lipid-soluble extracts of (A) MCF-7 cells and (B) MCF-7 tumor xenograft. Spectra were acquired on a Bruker Avance 11.7 T spectrometer and are expanded to display signals from 0 to 5.5 ppm (except for 3.7–4.8 ppm). Lipid spectra were acquired with a 30° flip angle, 10,000 Hz sweep width, 11.2 s repetition time, 32 K block size, and 128 scans. Peak assignments are: TMS, tetramethylsilane (internal standard) at 0 ppm, methyl groups assigned to C18 of cholesterol (C18) at ~0.7 ppm, the methyl groups (–CH3) at ~0.9 ppm, methylene groups (–(CH2)n–) at ~1.3 ppm, and ethylene groups (–CH=CH–) at ~5.4 ppm in acyl chains of lipids, –CH2–N in phosphatidylethanolamine at ~3.1 ppm, and the choline group (–N+(CH3)3) primarily from phosphatidylcholine at ~3.2 ppm.

