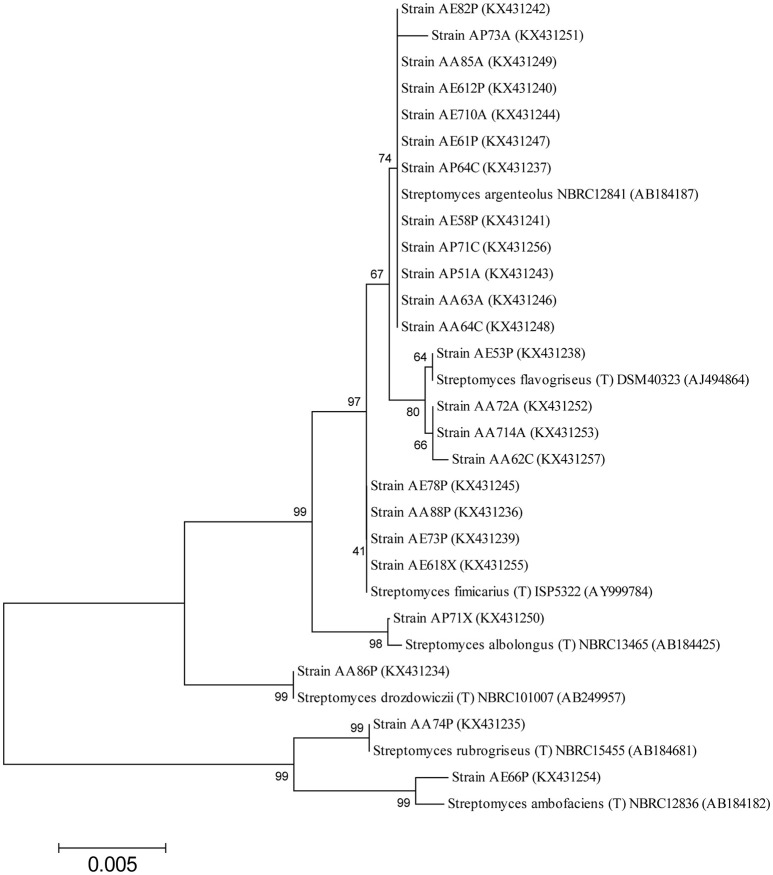
Figure 2.
Neighbor-Joining tree based on the comparison of 16S rRNA gene sequences showing the relationships among Streptomyces strains. Bootstrap values (expressed as percentages of 1000 replications) are given at the nodes. The sequence accession numbers used for the phylogenetic analysis are shown in parentheses following the species name. Strains marked with “(T)” represent type strains. The scale bar estimates the number of substitutions per site.

