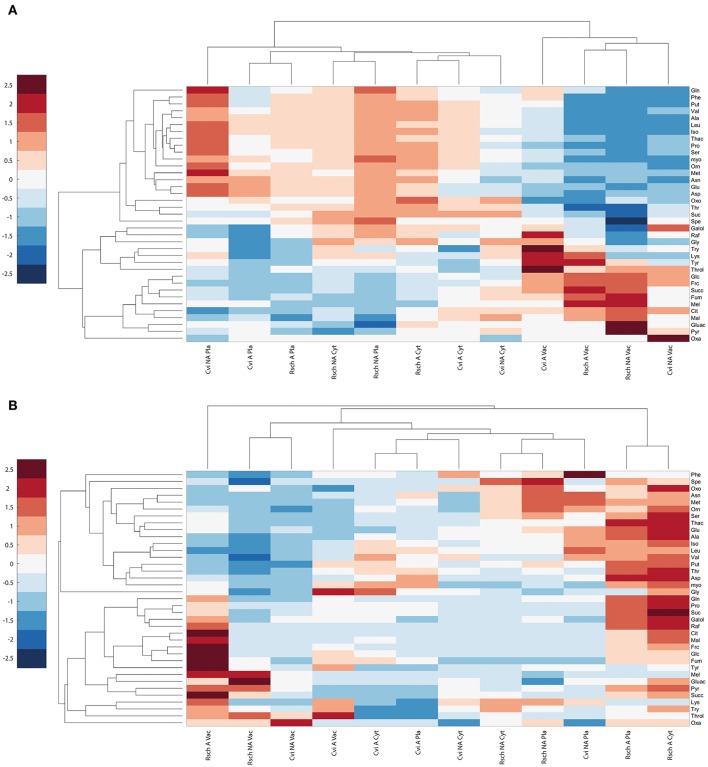
Figure 5.
Cluster analysis of relative and absolute subcellular metabolite distributions in Cvi and Rsch. (A) Relative distribution of metabolites, (B) Absolute levels per compartment. Mean values of relative and absolute levels of non-acclimated (NA) and acclimated (A) samples (n ≥ 6) were scaled by zero mean-unit variance (z-scores). Frc, Fructose; Galol, Galactinol; Glc, Glucose; Mel, Melibiose; myo, myo-Inositol; Raf, Raffinose; Suc, Sucrose; Throl, Threitol; Cit, Citrate; Fum, Fumarate; Gluac, Gluconate; Mal, Malate; Oxa, Oxaloacetate; Oxo, 2-Oxoglutarate; Pyr, Pyruvate; Succ, Succinate; Thac, Threonate; Ala, Alanine; Asn, Asparagine; Asp, Aspartate; Glu, Glutamate; Gln, Glutamine; Iso, Isoleucine; Leu, Leucine; Lys, Lysine; Met, Methionine; Orn, Ornithine; Phe, Phenylalanine; Pro, Proline; Ser, Serine; Thr, Threonine; Try, Tryptophan; Tyr, Tyrosine; Val, Valine; Spe, Spermidine; Put, Putrescine; Pla, Plastid; Cyt, Cytosol; Vac, Vacuole.

