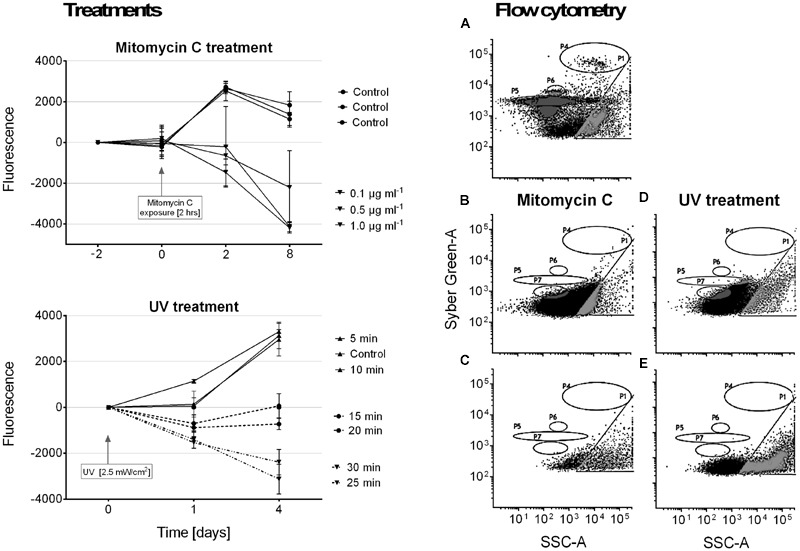
FIGURE 4.

Results of lysogenic virus induction experiments using mitomycin C and UV light treatments. Panel on the left shows cyanobacterial growth, measured as fluorescence, in response to the respective treatments. Samples were normalized by calculating differences from starting values. Panels on the right show examples of particle size distributions from flow cytometry measurements after treatment (quantification not included due to no hits in relevant areas). In accordance with measured known references (Pollock et al., 2014), gate P4 = bacteria populations, and gates P5–P7 = virus like particles (VLPs). (A) Reference plot of bacteria and virus populations, (B) 2 h mitomycin C exposure at 1 μg/ml, (C) mitomycin C control measurement, (D) 30 min UV exposure, (E) UV treatment control measurement.
