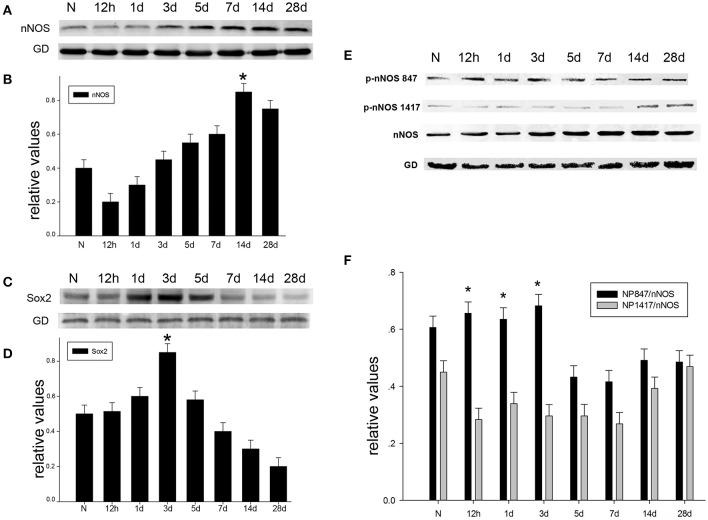
Figure 1.
The time-dependent variation in nNOS/Sox2/p-nNOS protein expression after brain injury in rats. (A) The time course of the protein expression of nNOS in adult rat hippocampus following TBI by Western blot. (B) The relative protein contents of nNOS were calculated by densitometry analysis, and the data were normalized to corresponding GAPDH levels. (C) The time course of Sox2 protein expression in adult rat hippocampus following TBI as determined by Western blot. (D) The relative protein contents of Sox2 were calculated by densitometry analysis, and the data were normalized to corresponding GAPDH levels. (E) The time course of the protein expression of p-nNOS in adult rat hippocampus following TBI as determined by Western blot. (F) Graphs (relative optical density) quantifying the intensity of the staining of p-nNOS compared to corresponding nNOS levels at each time point. The values are presented as the mean ± SEM (n = 3). *P < 0.05 indicates significant differences compared to the sham group.

