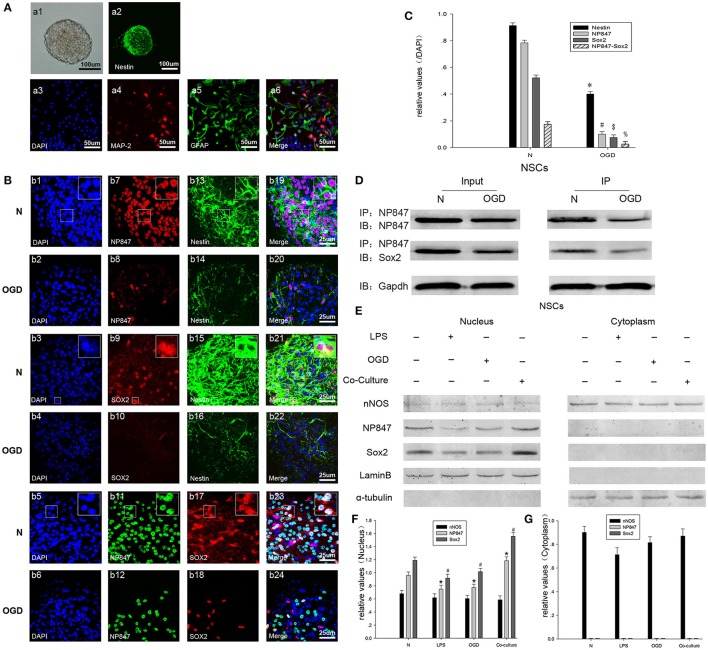
Figure 3.
NP847 co-localized with Sox2 in the nuclei of NSCs. (A) Neurospheres were cultured as low-density cell suspensions in the presence of epidermal growth factor and basic fibroblast growth factor. And neurosphere was observed by light microscope (a1, scale bar: 100 μm). Then neurospheres were planted on coverslips and the expression of Nestin was detected (a2, scale bar: 100 μm). Fetal bovine serum was added into the NSCs culture medium to stimulate the differentiation of NSCs and expression of MAP-2 (a4) and GFAP (a5) was detected. Scale bars: 50 μm. (B) Immunofluorescence was performed to detect NP847 (red, b7, b8; green, b11, b12), Sox2 (red, b9, b10, b17, b18), and Nestin (green, b13–16). The nuclei were stained with DAPI (blue, b1–6). (b19) and (b20) show the co-localization of NP847 (red) and Nestin (green) (small panels represent high magnification images). (b21) and (b22) show the co-localization of Sox2 (red) and Nestin (green) (small panels represent high magnification images). In (b23) and (b24), the white color visualized in merged images represents the co-localization of NP847 and Sox2 in the nuclei of NSCs (small panels represent high magnification images). The expression of NP847, Sox2, and Nestin decreased after OGD (oxygen glucose deprivation) compared with the normal group. Scale bars: 25 μm. (C) Graphs (relative optical density) quantifying the intensity of (B). (D) Immunoprecipitation showed that the interaction of NP847 and Sox2 significantly decreased in NSCs suffered from OGD compared to the sham group. (F) To further determine the sub cellular locations of NP847 and Sox2 in NSCs, primary NSCs were treated with either LPS (100 μM) or OGD for 12 h. Then, nuclear extracts and cytoplasmic extracts were prepared, and protein expression was examined by western blotting. Neuronal NOS is mostly located in the cytoplasm of NSCs, while NP847 and Sox2 are confined to the nuclei of NSCs. Panels (F) and (G) are graphs (relative optical density) quantifying the intensity of (E). The values are presented as the mean ± SEM (n = 3). %$#*P < 0.05 indicates significant differences compared to the sham group.

