
FIGURE 10.
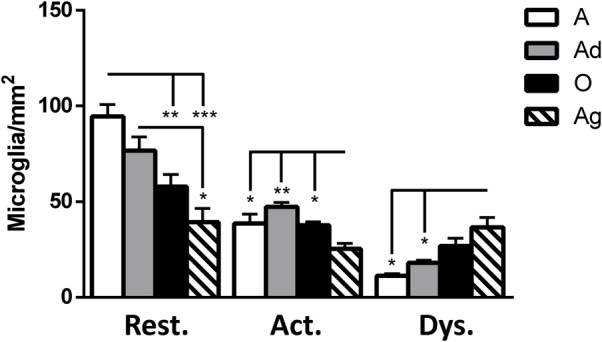
Quantification of resting, active and dystrophic microglia per area (mm2) in dorsal hippocampus of marmosets at different ages (A: adolescents, Ad: adults, O: old, and Ag: aged). One way ANOVA, post hoc analysis Tukey (∗p < 0.05; ∗∗p < 0.01; ∗∗∗p < 0.001).