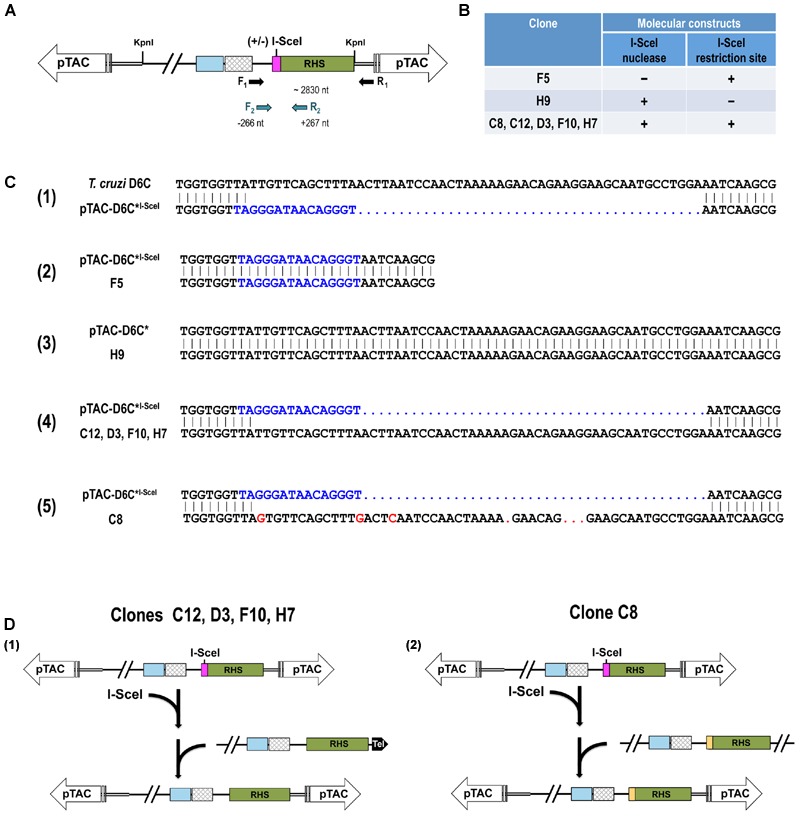
FIGURE 3.

Analysis of double-strand break repair events. (A) Schematic representation of PCR strategy used to amplify a 2.8-kb fragment of pTAC-D6C∗I-SceI sequence spanning the I-SceI site in mutant T. cruzi epimastigotes. Fragments amplified with primers F1 and R1 were cloned into pGEM-T, and a nested PCR based on primers F2 and R2 was used to sequence the DSB region. (B) Summary table showing molecular constructs present in cloned cell lines of T. cruzi transfected-epimastigotes. (C) Nucleotide sequence alignment of the region adjacent to the DSB site in the wild-type T. cruzi telomeric sequence cloned into BAC-D6C with the D6C∗I-SceI sequence including the I-SceI restriction site (in blue) (1); pTAC-D6C∗I-SceI vector with pTAC-D6C∗I-SceI mutant clone F5 (2); pTAC-D6C∗ vector with pTREX-(SV40)I-SceI-GFP/pTAC-D6C∗ mutant clone H9 (3); pTAC-D6C∗I-SceI vector with pTREX-(SV40)I-SceI-GFP/pTAC-D6C∗I-SceI mutant clones C12, D3, F10 and H7 (4); pTAC-D6C∗I-SceI vector with pTREX-(SV40)I-SceI-GFP/pTAC-D6C∗I-SceI mutant clone C8 (5). (D) Representation of DSB repair events by homologous recombination (HR). Recombination between regions flanking the I-SceI site in the pTAC-D6C∗I-SceI molecule may have led to loss of the I-SceI site and replacement of this site with genomic sequences. Schemas (1,2) are representations of events shown in (B).
