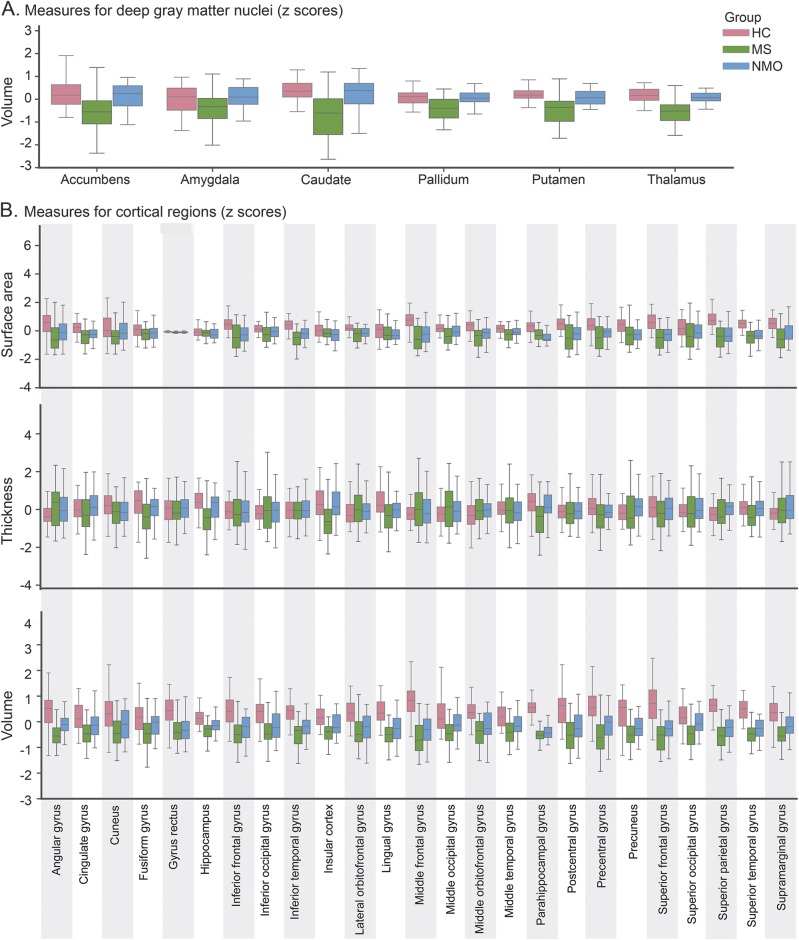
Figure 2. Descriptive statistics of the thickness, surface, and volume of deep gray matter (DGM) nuclei and cortical regions.
(A) DGM nuclei. (B) Cortical regions. Left and right hemisphere values are averaged for better visualization. All measures have been normalized, and the Z scores were calculated. HC = healthy control; MS = multiple sclerosis; NMO = neuromyelitis optica.

