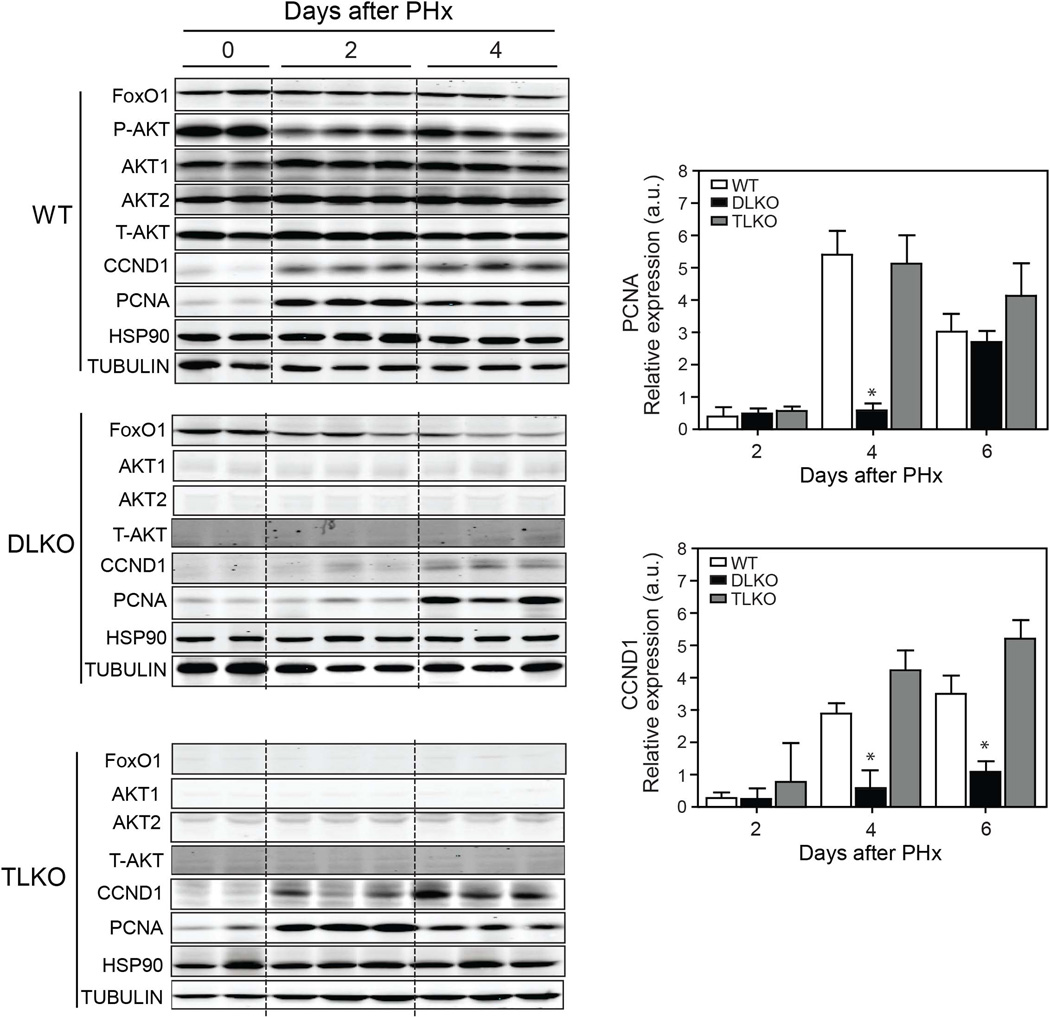
Figure 3. Loss of FoxO1 normalized the expression of CCND1 and PCNA in Akt-deficient regenerative livers.
Western blot analysis of indicated proteins in livers lysated from WT, DLKO and TLKO before (T=0 days) and after PH (T=2 and 4 days). HSP90 and tubulin were used as loading controls. The right panels show the densitometry analysis of hepatic CCND1 and PCNA expression in WT, DLKO and TLKO before and after PH. Results are represented as mean ± S.E.M. *P<0.05 vs. WT at the same day.

