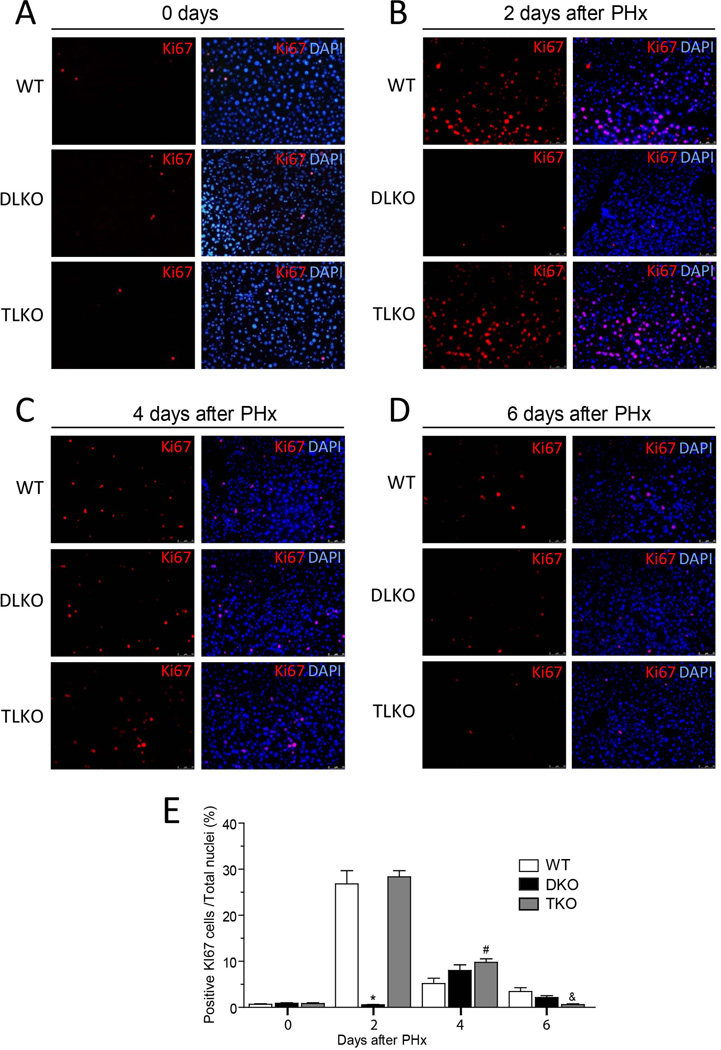
Figure 4. Genetic ablation of FoxO1 restored cell proliferation in Akt-deficient regenerative livers.
(A–D) Representative immunofluorescence pictures for the Ki-67 positive cells in WT, DLKO and TLKO livers at 0 (A), 2 (B), 4 (C) and 6 (D) days following PH. Merged images on right panels show co-localization of Ki-67 (red) and nuclear DNA (DAPI, blue). Original magnification 100×, (n=2 to 10). The bottom graph (E) shows the computed-assisted quantification of positive Ki-67 cells / total nuclei at different times following PH. Mean ± S.E.M is shown. *P<0.001 vs. WT and TLKO at the same day, #P<0.01 vs. WT at the same day, &P<0.05 vs. WT and DLKO at the same day.

