
FIGURE 1.
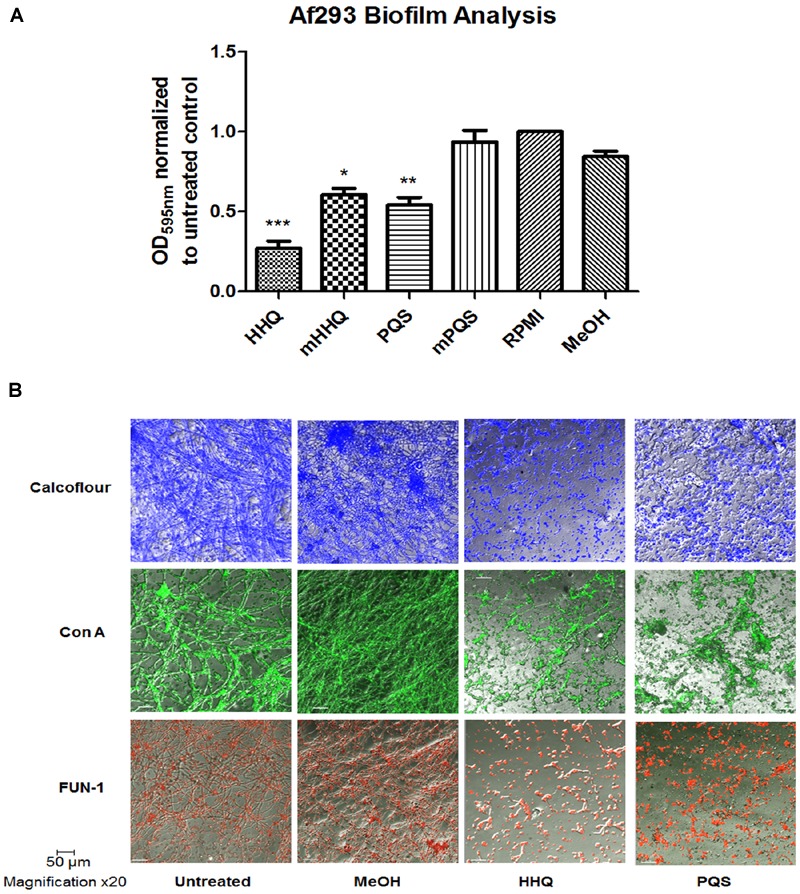
Suppression of A. fumigatus biofilm formation in response to HHQ and PQS. (A) Biofilm assays using crystal violet (CV) staining. mPQS and mHHQ refer to the parent compounds with the C7 alkyl chain removed. RPMI constitutes the untreated sample whereby no compound or carrier has been added. Data is presented as mean fold change (+/- SEM) of Abs595nm relative to untreated cells. Data is representative of five independent biological replicates. Statistical significance using methanol treated cells as reference is represented by one way ANOVA with post hoc Bonferroni correction (∗p < 0.05, ∗∗p < 0.005; ∗∗∗P < 0.001). (B) Confocal microscopic analysis (×20) of biofilm formation on plastic coverslips. Staining was performed using Calcofluor-1 (cellulose and chitin), Concanavalin A (live cellular vacuoles), and FUN-1 (lectins/carbohydrates).