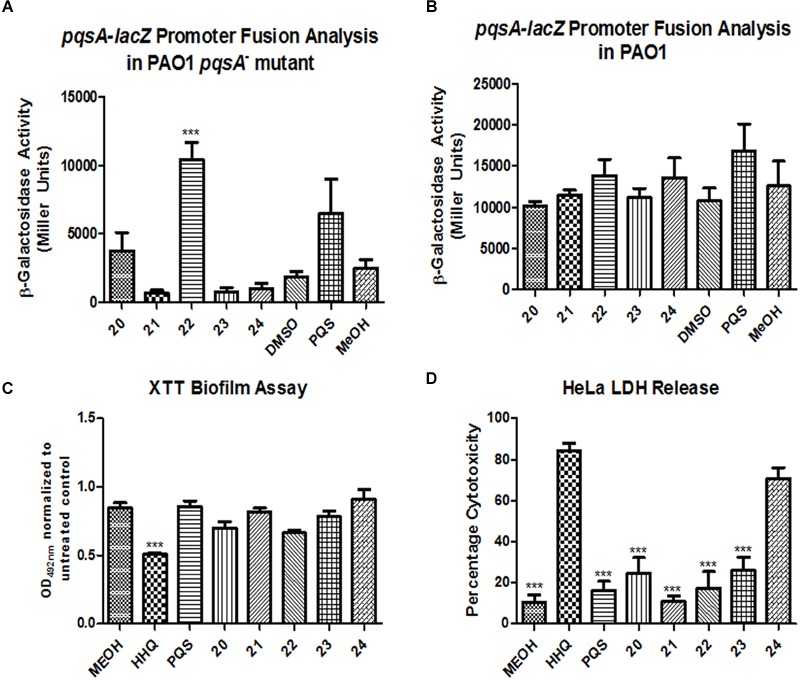
FIGURE 7.

Profiling the spectrum of activity of compounds 20–24. Promoter fusion analysis of the pqsA-lacZ pLP0996 plasmid in (A) a PAO1 pqsA- mutant, and (B) PAO1 wild-type strain, (C) XTT biofilm analysis of C. albicans and (D) LDH release cytotoxicity assays using HeLa cell lines. Data in all experiments is the mean (+/- SEM) of at least three independent biological replicates. Statistical analysis was performed by one-way ANOVA with post hoc Bonferroni correction (∗∗∗p ≤ 0.001).
