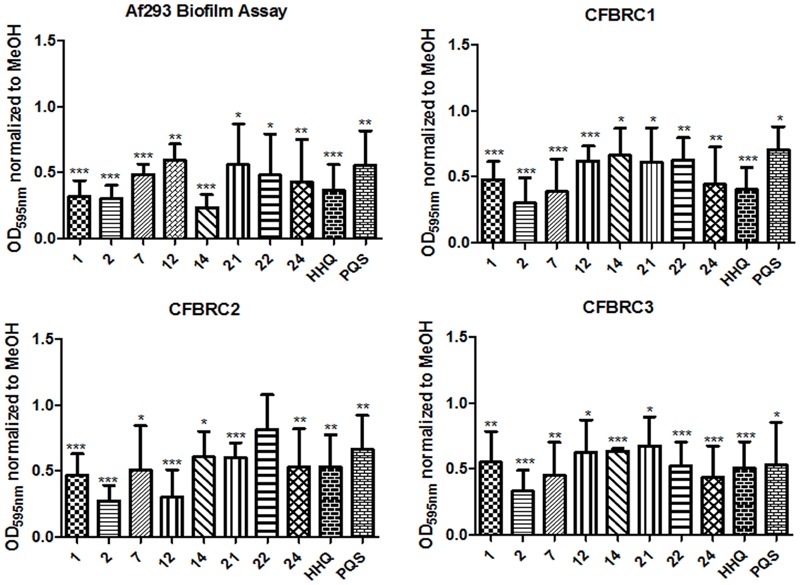
FIGURE 9.

Biofilm formation in A. fumigatus clinical isolates following incubation with AHQ analogs. Data is presented as mean fold change (+/- SEM) in OD595nm relative to methanol treated cells and includes at least three independent biological replicates. Statistical significance is represented by Bootstratio analysis (∗p < 0.05; ∗∗p < 0.005; ∗∗∗P < 0.001).
