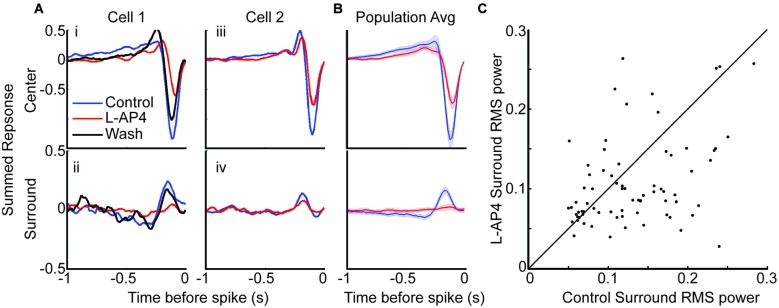
Figure 4.
The antagonistic surround relies heavily on contribution from crossover circuits. (A) Space-time maps are divided into center and surround spatial regions. The temporal traces in the center region are combined (row 1) as are those in the surround region (row 2). (i,ii) An example cell with center and surround traces under control (blue), L-AP4 (red) and wash (black) conditions. This cell’s surround is lost with L-AP4. (iii,iv) An example cell that maintained surround response with L-AP4. (B) Mean center and surround before and after L-AP4 are shown. Shaded area indicates 1 standard error. (C) root mean square (RMS) power in the surround signal was calculated before and after L-AP4. There is a significant decrease in surround RMS power with addition of L-AP4. To account for noise contribution to the RMS power, we recalculated STAs to have the same number of spikes before and after L-AP4. Fewer cells had responsive STA under both conditions when STAs were recalculated with fewer spikes (n = 84).

