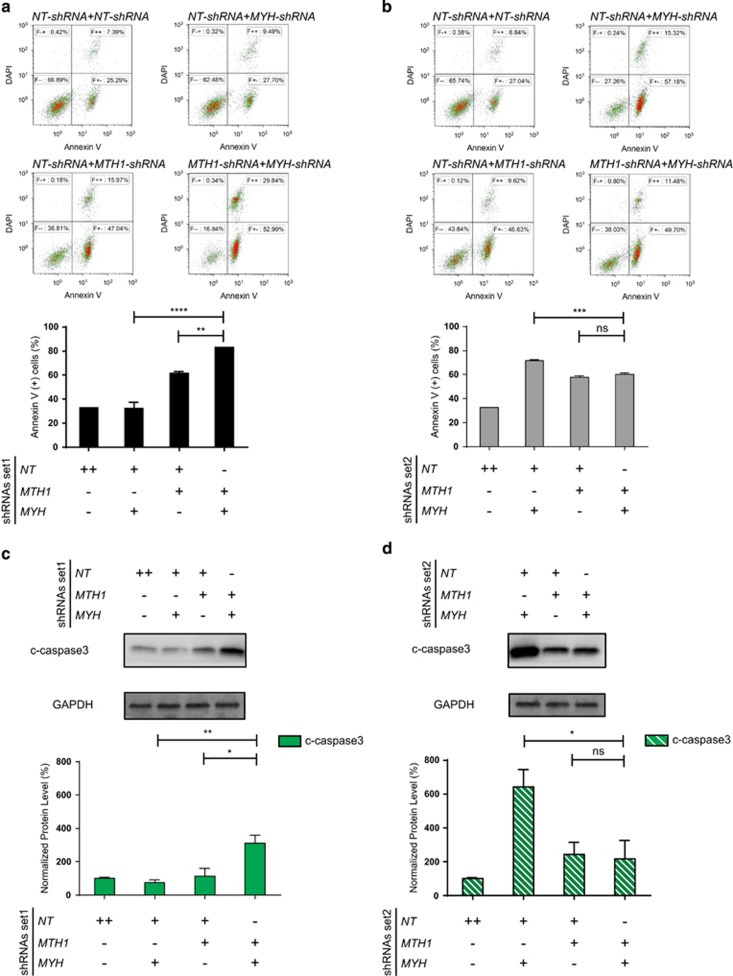
Figure 3.
hMYH level dictates the apoptosis level in hMTH1-depleted cells. Apoptosis induction was 96 h post treatment with Dox by measuring Annexin V-positive population in the cells expressing shRNA set1 (a) and shRNA set2 (b). One representative DAPI versus Annexin V scatter plot is shown for each condition. Quantified data are illustrated in bar charts representing mean±s.e.m. from three independent experiments in duplicate. The same membranes in Figure 1 were used to measure the induction of apoptosis (cleaved (c)-caspase 3) after 96 h of Dox treatment in the cells expressing shRNA set1 (c) and shRNA set2 (d) The signals were quantified using Image Studio Lite (LI-COR), and double normalized with GAPDH and NT-shRNA control samples. One-way analysis of variance (ANOVA) was performed to calculate P-values. *P<0.05, **P<0.01, ***P<0.001, ****P⩽0.0001, NS, not significant.

