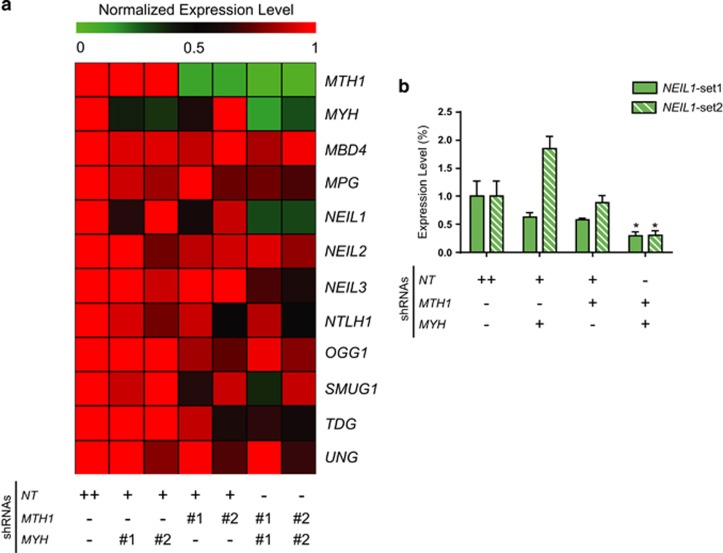
Figure 5.
NEIL1 was downregulated upon concurrent suppression of MTH1 and MYH. (a) Expression of DNA glycosylases were analyzed after 96 h of Dox treatment using qRT–PCR and the results are shown in a heat-map diagram. (b) Detailed NEIL1 expression levels are represented in a bar chart. Data are presented as mean±s.e.m. from three independent experiments in triplicate. P-values were obtained using one-way analysis of variance (ANOVA). *P<0.05.

