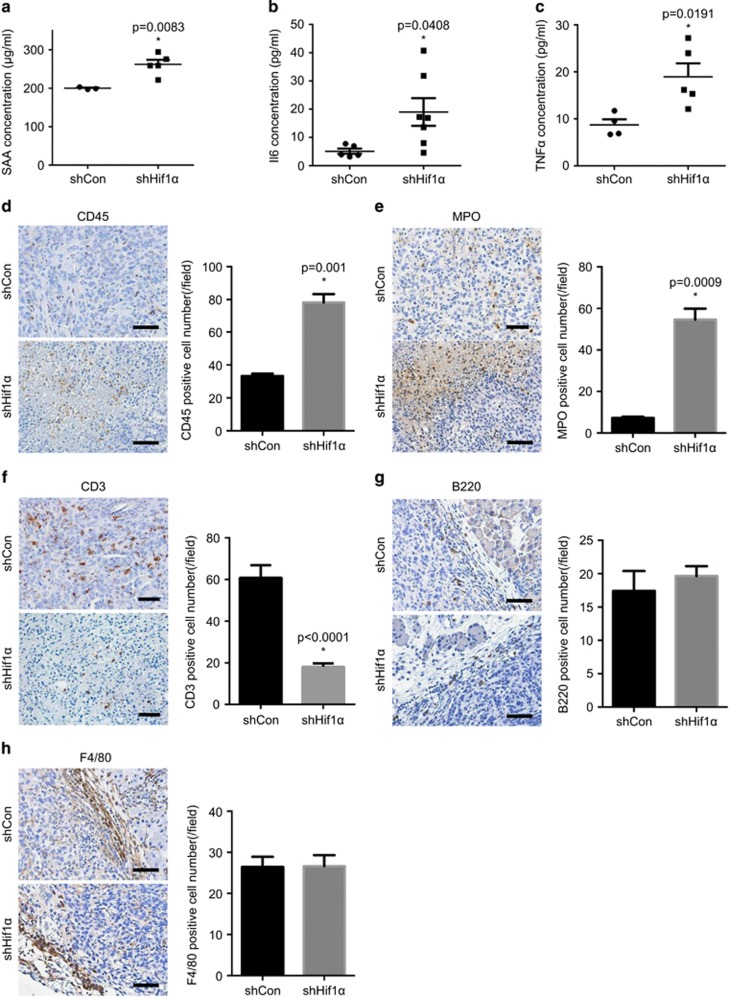
Figure 3.
Increased inflammatory response triggered by Hif1α depletion. (a–c) Elevated levels of SAA (a), Il6 (b) and TNFα (c) are detected in the serums of shHif1α cells-transplanted animals compared with controls. (d) Representative IHC pictures of CD45 and quantitative analysis demonstrate increased immune cells infiltration (especially in necrotic areas) in the shHif1α tumours. (e) Representative IHC pictures of MPO and quantitative analysis reveal that neutrophils are the most infiltrated immune cells in the shHif1α tumours. (f) IHC staining of CD3 and quantitative analysis show reduced T-cell infiltration in the shHif1α tumours, which is confirmed by the quantitative analysis. Scale bar, 200 μm. (g–h) Representative IHC pictures and quantitative analysis of B220 (g) and F4/80 (h) show no difference in B cells and macrophages infiltration between shControl and shHif1α tumours. Scale bar, 200 μm. All data are presented as mean±s.e.m., and the statistical difference is determined by unpaired t-test. *P<0.05. See Supplementary Materials and Methods.

