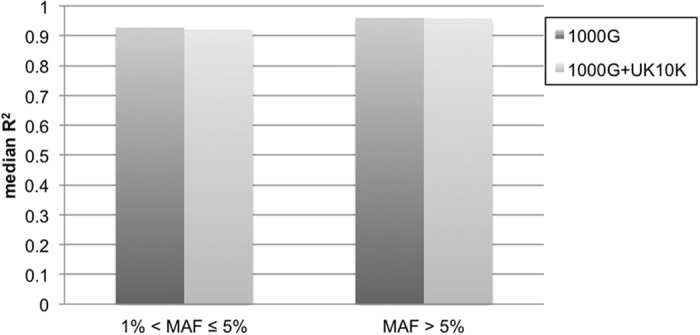
Figure 2. Imputation quality of NCS data evaluated by squared correlation (R2) between actual allelic dosages and imputed allelic dosages from imputations with 1000 G and 1000 G + UK10K.

The actual allelic dosages were from the input genotype data, and the actual genotypes were first masked and then imputed to get imputed allelic dosages. The MAFs were estimated from variants imputed with 1000 G + UK10K.
