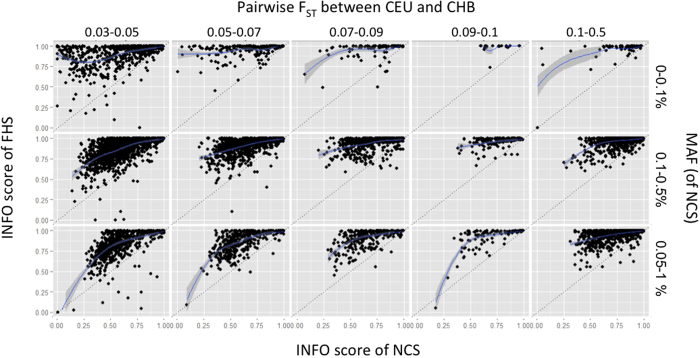
Figure 3. Correlation between the FHS and NCS imputation results, by MAF and FST.
The x and y axes of each small plot are INFO scores of FHS and NCS. Small plots show distribution of two INFO scores within a range of FST and MAF. CEU and CHB stand for Utah residents with ancestry from Northern and Western Europe and Han Chinese in Beijing.

