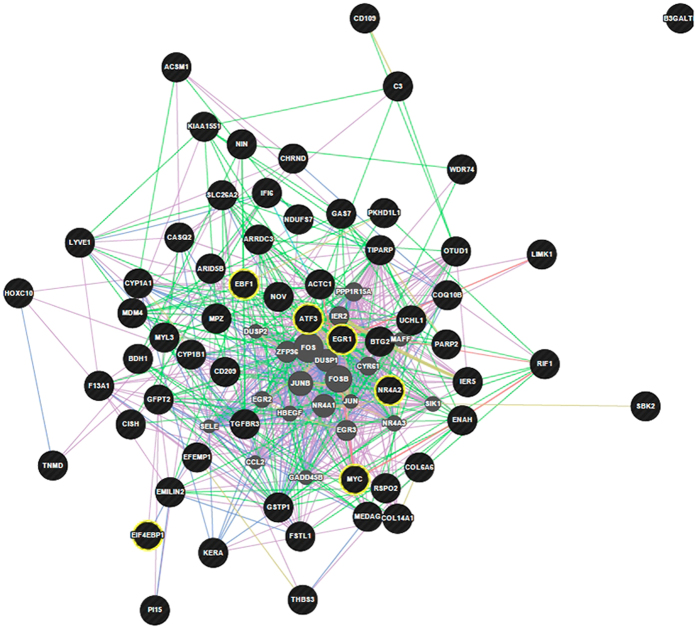
Figure 1. Network integration of differentially expressed genes between the efficient (LRFI) and inefficient (HRFI) groups.
Genes presented as black circles were differentially expressed (DE) between the efficient (LRFI) and inefficient (HRFI) groups. Genes presented in grey interact with the DE genes. Circles highlighted in yellow are transcription factors. Arrows in pink, green, blue and red represent co-expression relationships, genetic interactions, co-localizations and physical interactions, respectively.

