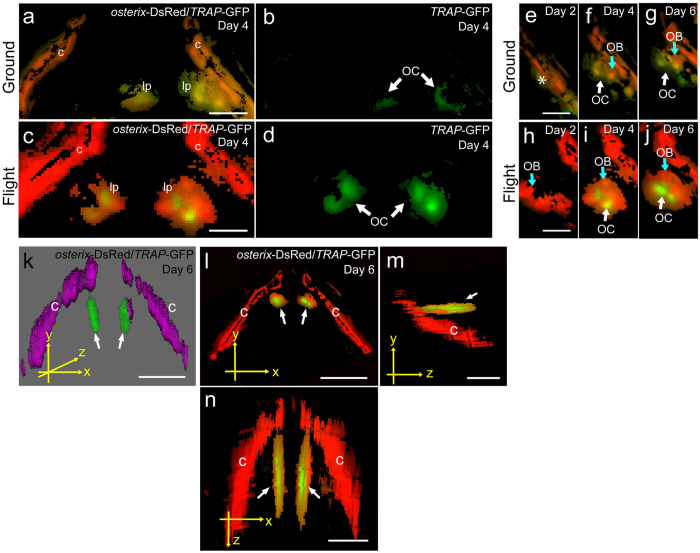
Figure 5. 3D imaging for osteoblasts and osteoclasts in flight group.
(a–n) The merged images were captured by 3D views for osterix-DsRed and TRAP-GFP in the pharyngeal bone region of the double transgenic line. The images were processed by use of Fiji software. (a,c) The pharyngeal bone region in the ground control (a) and the flight (c) group at day 4. lp, lower pharyngeal bone; c, cleithrum. Scale bars = 20 μm. (b,d) Images for TRAP-GFP in the pharyngeal bone region of “a” and “c”, respectively. GFP signals identify osteoclasts (OC). (e–j) Development of osteoblasts (OB) and osteoclasts (OC) in the lower pharyngeal bone region in the ground control (e–g) and flight (h–j) groups. Scale bars = 20 μm. No signals of osterix-DsRed and TRAP-GFP were detected in the pharyngeal bone region (e, asterisk). The osterix-DsRed and TRAP-GFP were weakly expressed at the low pharyngeal bone region at days 4 and 6 in the ground control (f,g). The osterix-DsRed in osteoblasts (OB) was highly expressed at the low pharyngeal bone region at day 2 (h). TRAP-GFP signals in osteoclasts (OC) appeared near osterix-DsRed signals at day 4 (i). TRAP-GFP signals were spread at the low pharyngeal bone region at day 6 (j). (k–n) Localization of osteoblasts and osteoclasts. White arrows show GFP signals in the lower pharyngeal bone. c, cleithrum. 3D image for osterix-DsRed/TRAP-GFP at day 6 (k). Osteoblasts and osteoclasts are shown in magenta and green, respectively. This image was not analyzed by the deconvolution algorithm, and thus the signals appear as an out-of-focus blur. The views were captured on the x-y plane (l), y-z plane (m), and x-z plane (n) from 3D images. Scale bars = 50 μm.

