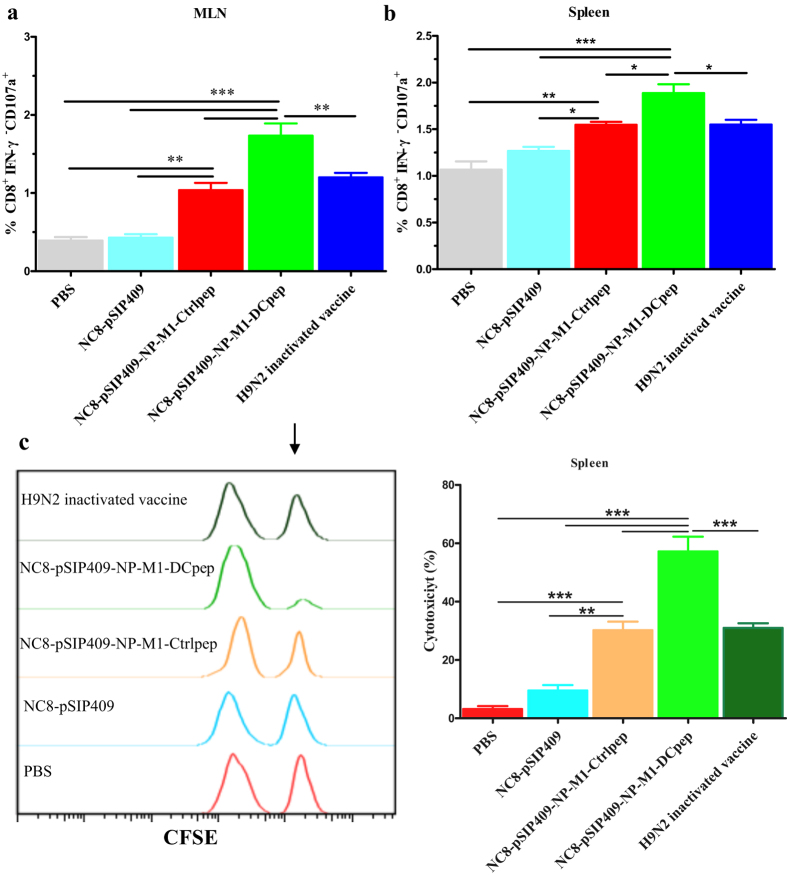
Figure 6. Spleen resident CD8 T cells express perforin and lyse peptide-pulsed targets.
(a,b) The frequency of CD107a-producing CD8+ T cells from MLNs and splenocytes was analysed two weeks after boost vaccination. (c) The splenocytes from naive mice stained with CFSE were injected into vaccinated mice after being coated with the NP and M1 peptides. The in vivo cell-mediated cytotoxicity was characterized at 18 h. The black arrow shows the NP and M1-pulsed, CFSEHigh target cells. The data are the mean values ± SEM (n = 5) and were analysed by using a one-way ANOVA, assuming a Gaussian distribution, followed by Dunnett’s post-test and are expressed relative to PBS, NC8-pSIP409 and NC8-pSIP409-NP-M1-Ctrlpep and to the H9N2 inactivated vaccine (*P < 0.05, **P < 0.01, and ***P < 0.001). The data shown represent one of the three experiments with equivalent results.

