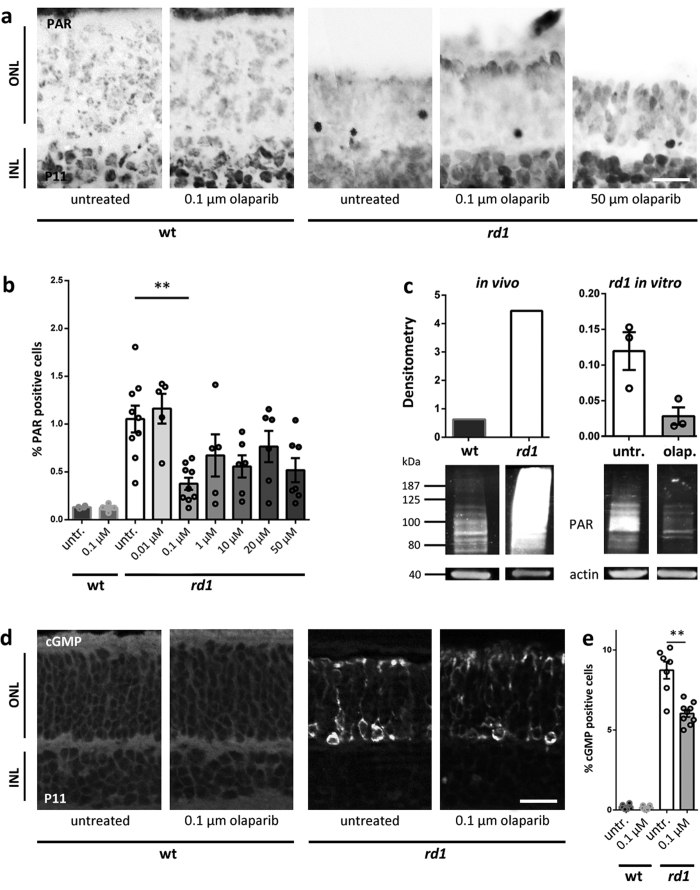
Figure 2. Effect of PARP inhibition with olaparib on PARylation and cGMP levels in rd1 retinal cultures.
(a,b) The higher the concentration of olaparib, the smaller was the percentage of PAR positive cells. (c) Western blot analysis confirmed the previously reported strong PARylation difference between rd1 and wildtype (wt) retinas8,9. Furthermore, there was a strong reduction of PARylation in rd1 cultures treated with 100 nM olaparib compared to control cultures. (d) Immunohistochemical stainings showed an increase of cGMP level in rd1 compared to wt. (e) Quantification of the cGMP signal revealed a significant reduction due to treatment with olaparib. Bar graphs represent means ± SEM. n(wt, untreated) = 6; n(wt, 0.1 μM olaparib) = 6; n(rd1, untreated) = 9; n(rd1, 0.01 μM olaparib) = 5; n(rd1, 0.1 μM olaparib) = 9; n(rd1, 1 μM olaparib) = 7; n(rd1, 10 μM olaparib) = 7; n(rd1, 20 μM olaparib) = 4; n(rd1, 50 μM olaparib) = 6; n(WB, in vivo, rd1) = 1; n(WB, in vivo, wt) = 1; n(WB, in vitro, rd1, untreated) = 3; n(WB, in vitro, rd1, olaparib) = 3. **p < 0.01 by Kruskal-Wallis test for multiple analysis; scale bars in (a and d) are 20 μm.

