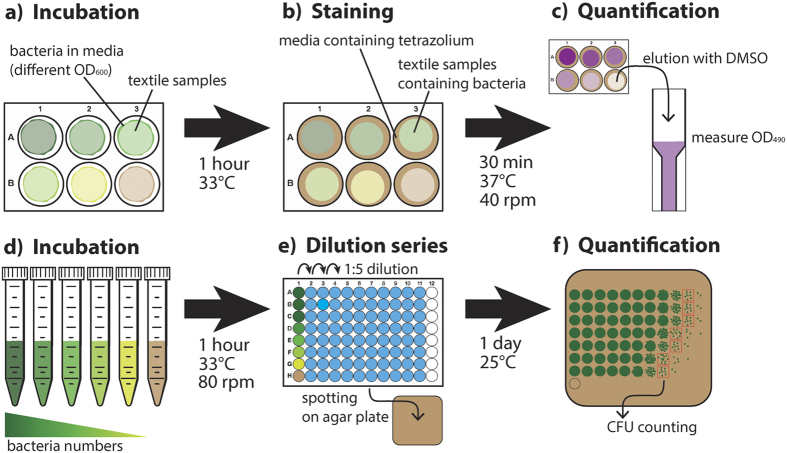
Figure 5. Scheme of the experimental procedure for generating the standard curve.
Bacterial cells were directly added to the textiles and incubated to allow adhesion (a). The textiles were then stained with the medium containing INT (b). The dye was then eluted for quantification (c). The same culture applied to the textiles was also incubated in tubes (d) to prepare dilution series at the same time point as for staining (e), which were used to quantify bacterial CFU on agar (f). Using different dilution of bacterial culture allowed the generation of a standard curve correlating INT staining intensity with CFU.

