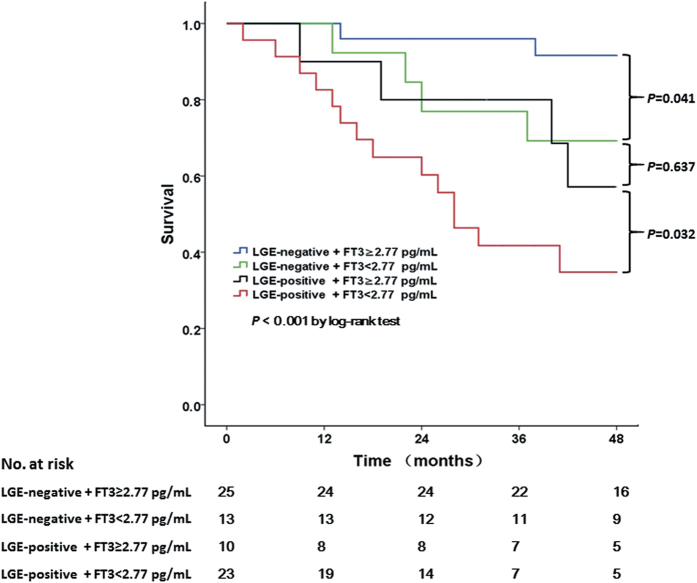
Figure 2. Kaplan-Meier curves comparing the probability of all-cause death.
The LGE-positive+ FT3 < 2.77 pg/mL group had the worst prognosis. Importantly, survival in the LGE-negative+ FT3 < 2.77 pg/mL group was intermediate, but comparable with that in the LGE-positive+ FT3 ≥ 2.77 pg/mL group (p = 0.637).

