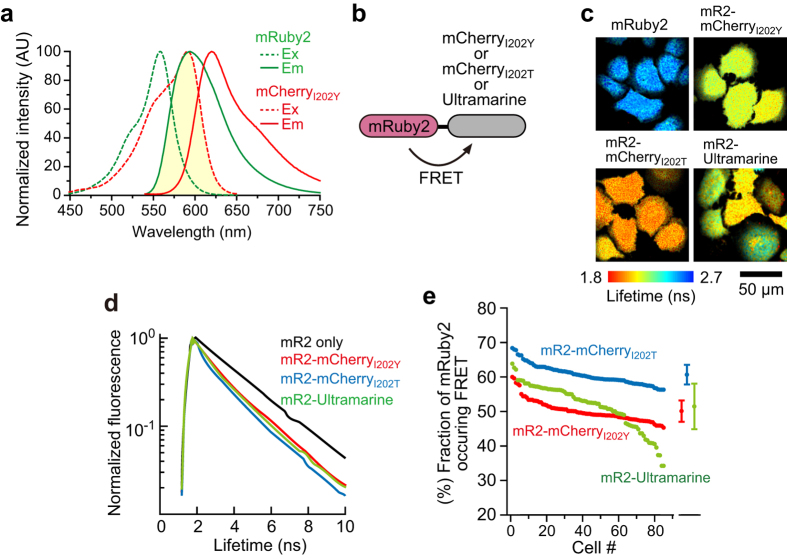
Figure 2. FRET efficiency and the proportion of matured mCherry mutants.
(a) The spectral overlap (yellow region) between the mRuby2 emission spectrum and mCherryI202Y excitation spectrum. AU: arbitrary units. (b) A schematic drawing of the tandem fluorescent protein used for evaluation of the FRET and chromophore maturation efficiency. (c) Representative fluorescence lifetime images of the mRuby2 and mRuby2-based tandem fluorescent proteins in HeLa cells; the images were taken at 1000-nm two-photon excitation. Because the expression level of mRuby2-Ultramarine was low, laser power of 2 mW was used, while 1 mW was used for mRuby2, mRuby2-mCherryI202Y, and mCherryI202T. The scale bar is 50 μm. (d) Lifetime curves of the mRuby2-based tandem fluorescent proteins in HeLa cells. (e) Fraction of mRuby2 occuring FRET of mRuby2 and mRuby2-based tandem fluorescent proteins in individual cells plotted in the descending order. The data plots are also presented as mean ± SD on the right (p < 0.05, analysis of variance [ANOVA] followed by Scheffé’s post hoc test).

