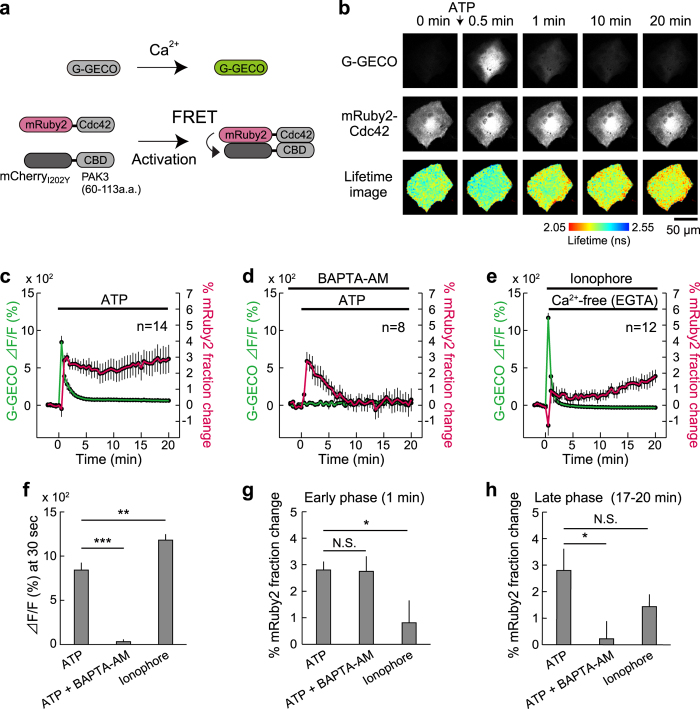
Figure 3. Dual observation of a Ca2+ transient and Cdc42 activation in astrocytes.
(a) A schematic of the G-GECO1.1 and Cdc42 FRET sensor activation. mCherryI202Y-CBD and mRuby2-Cdc42 are fused via P2A sequence (mCherryI202Y-CBD-P2A-mRuby2-Cdc42), leading to the equal amount of expression in cells. (b) Representative time-lapse images of dual observation of G-GECO fluorescence ([Ca2+] increase) (top), the fluorescence of mRuby2-Cdc42 (middle), and their fluorescence lifetime (bottom) in a cultured astrocyte after stimulation with 100 μM ATP. The scale bar is 50 μm. (c–e) Time course analyses of the Ca2+ response (green) and Cdc42 activation (the change in the mRuby2-Cdc42 proportion [fraction] undergoing FRET; magenta) after the application of ATP (c; n = 14), ATP application during Ca2+ chelation by means of 200 μM BAPTA-AM (d; n = 8), and application of 10 μM ionophore (e; n = 12). For the ionophore experiment, a nominal Ca2+-free buffer was used 30 s after ionophore application to stop the Ca2+ influx. (f–h) Quantitative analysis of the Ca2+ transient and Cdc42 activation. G-GECO fluorescence intensity at 30 s (f), the fraction of mRuby2-Cdc42 undergoing FRET (g,h) at the indicated time points after the respective stimulation data were compared. The data are presented as mean ± SEM. Statistical significance was determined by one-way analysis of variance (ANOVA) followed by Dunnett’s test. *P < 0.05, **P < 0.01, ***P < 0.001, N.S.: not significant.

