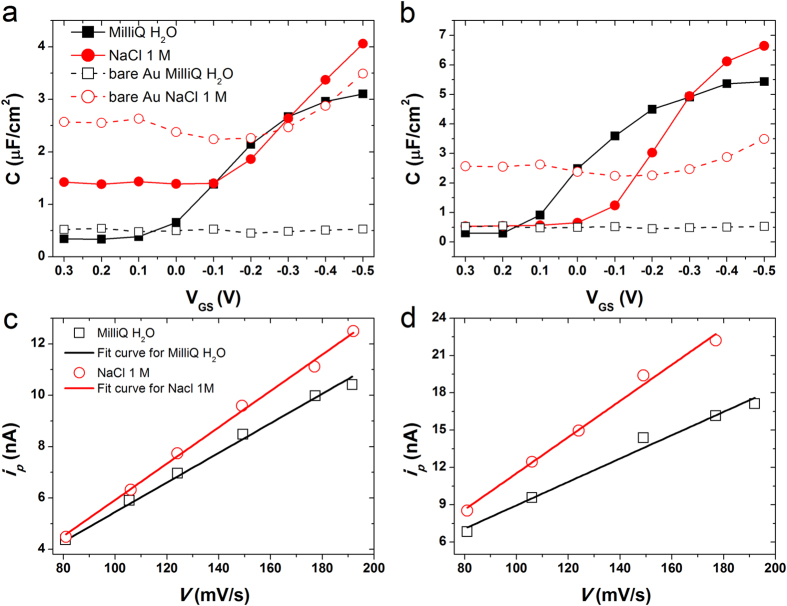
Figure 2.
Cdl vs VGS plots for (a) TIPS:PS/PFBT and (b) diF:PS/PFBT devices. Dashed black line (unfilled squares) is for MilliQ water and dashed red line (unfilled circles) stand for NaCl 1M related to bare Au. Solid lines (filled symbols) are the corresponding coated devices. Current peak (ip) versus scan rate (v) plots are shown for (c) TIPS:PS/PFBT and (d) diF:PS/PFBT devices. Black line and empty squares correspond to the linear fit in MilliQ water; red lines and empty circles are linear fit in NaCl 1M.

