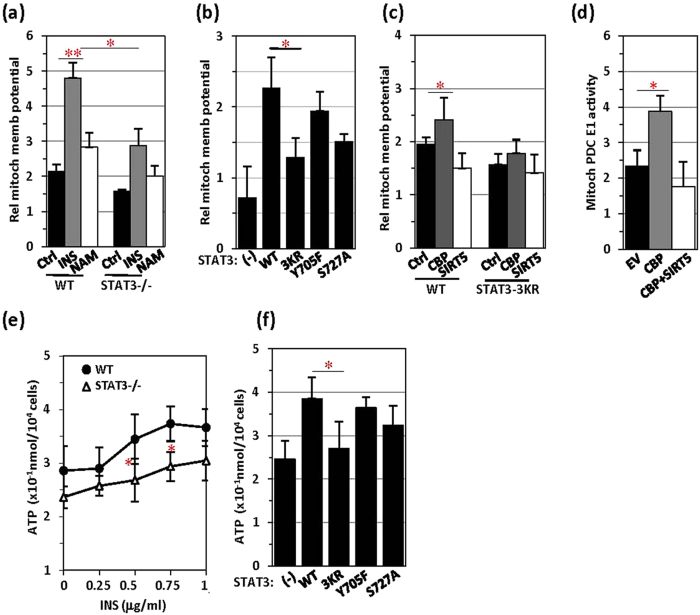
Figure 5. Mitochondrial membrane potential and ATP generation are inhibited by SIRT5.
(a) Wild-type or STAT3−/− MEFs were treated with insulin (5 μg/ml, 30 min) or NAM (100 μM, 6 hrs) and subjected to mitochondrial membrane potential analysis with JC-1 staining. (b) The mitochondrial membrane potential was measured in STAT3−/− MEFs transfected with STAT3 WT or mutants as indicated. (c) STAT3 WT or 3KR mutant MEFs were transfected with an EV, CBP and CBP together with SIRT5, and the mitochondrial membrane potential was measured. (d) PDC E1 activity (unit/104 cells) was measured in STAT3−/− MEFs transfected with an EV, CBP and CBP together with SIRT5. (e) ATP production was compared between STAT3 WT and STAT3−/− MEFs in response to treatment with insulin at the indicated concentrations. (f) In STAT3−/− MEFs, different forms of STAT3 were transiently transfected, and ATP levels were analysed.

