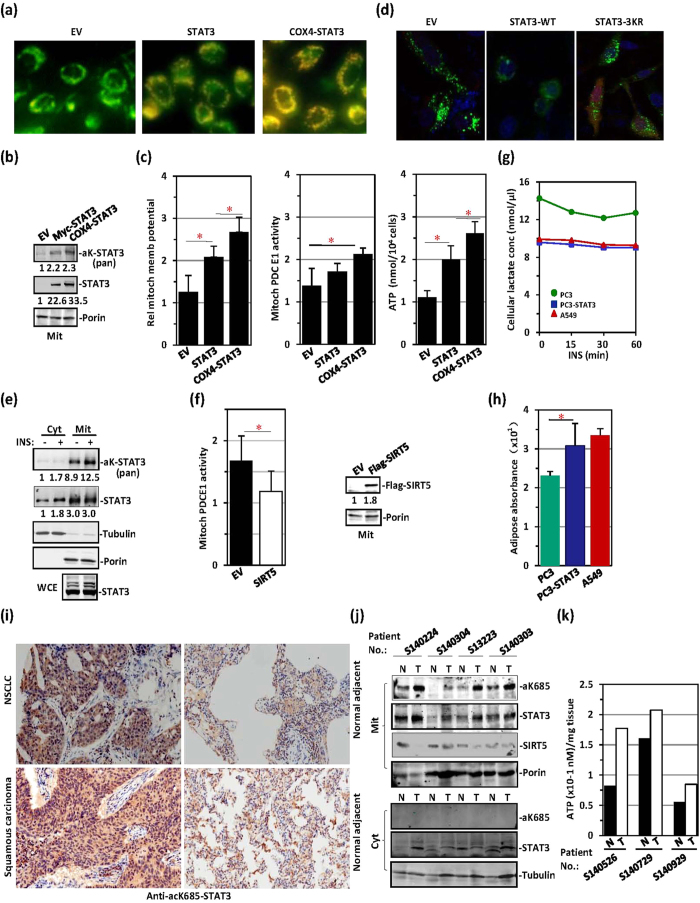
Figure 7. STAT3 constitutively translocates to mitochondria and affects TCA-respiratory chain function in cancer cells.
(a) PC3 cells (STAT3-null) were transfected with an EV, STAT3 or Cox4-STAT3 and visualized with the mitochondrial membrane potential dye JC-1. (b) Mitochondrial lysates from the above three types of PC3 cells were prepared for STAT3 acetylation analysis. (c) Mitochondrial membrane potential (left), mitochondrial PDC E1 activity (middle) and ATP production levels (right) were measured in the above three types of PC3 cells. (d) Parental PC3 cells (STAT3-null), PC3 cells expressing STAT3 WT, or PC3 cells expressing STAT3-3KR mutant were transfected with GFP-LC3 (green), stained with DAPI (blue), and subjected to confocal microscopy. (e) A549 cells were treated with or without insulin. STAT3 acetylation was detected with anti-pan-acetyl-lysine antibody in cytoplasmic and mitochondrial fractions. (f) Mitochondrial PDC E1 activity was measured in A549 cells transfected with an EV or Flag-SIRT5. Flag-SIRT5 levels (right) were detected via western blotting in these cells. (g) Lactate levels were measured in parental PC3 (green), PC3-STAT3 (blue) or A549 cells (red) after insulin treatment for the indicated times. (h) The absorbance of adipose droplets stained by Oil red O was measured in parental PC3 (green), PC3-STAT3 (blue) or A549 cells (red) at 490 nm in extracts prepared with isopropanol. (i) Lung tissue samples (cancer sections and adjacent normal sections) obtained from non-small cell adenocarcinoma and squamous carcinoma lung cancer patients were immunostained with polyclonal antibody against K685-acetylated STAT3. (j) Mitochondrial and cytoplasmic fractions were prepared from tumour tissue samples (T) and adjacent normal tissue samples (N) from 4 lung cancer patients. aK685-STAT3, STAT3, SIRT5 and porin were analysed in the mitochondrial fraction (upper panel), aK685-STAT3, STAT3 and tubulin were analysed in the cytoplasmic fraction (lower panel). (k) ATP production was compared between tumour tissue samples (T) and adjacent normal tissue samples (N) from 3 lung cancer patients.

