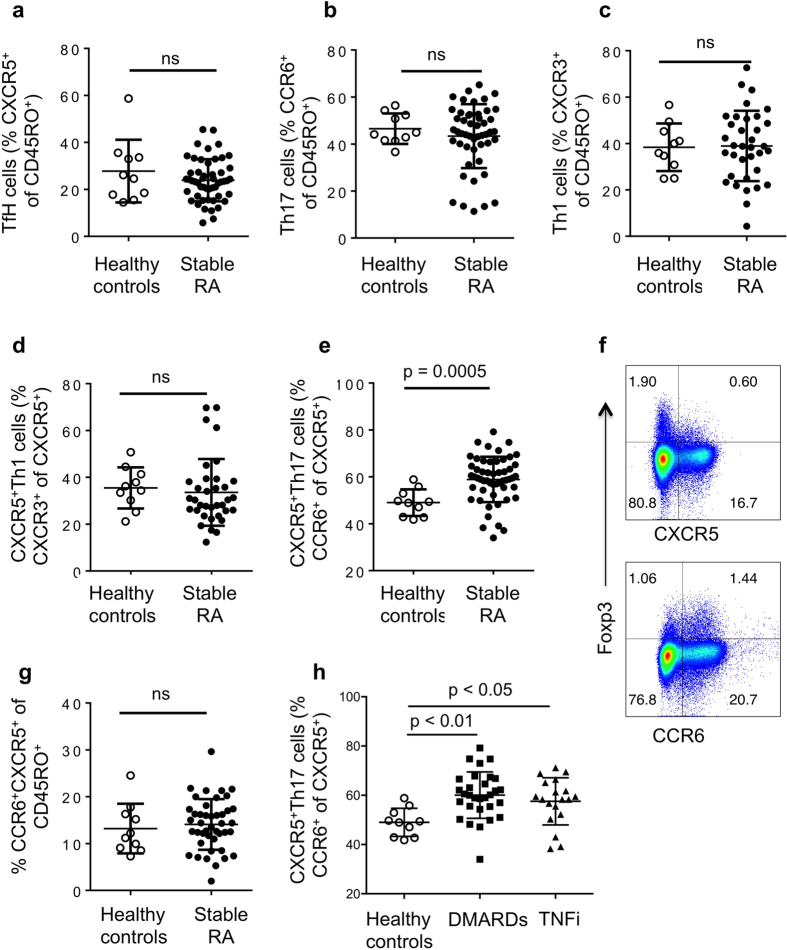
Figure 1. CXCR5+Th17 cells, but not other T helper subsets, are increased in RA.
PBMC from healthy controls and RA subjects on stable therapy (DMARDs or anti-TNF therapy) for 6 months or longer, as described in Table 1, were analyzed by flow cytometry. (a) TfH cells assessed as proportion CXCR5+ cells out of CD4+CD45RO+ cells in; (b) Th17 cells assessed as proportion of CCR6+ cells out of CD4+CD45RO+ cells; (c) Th1 cells assessed as proportion of CXCR3+ cells out of CD4+CD45RO+ cells; (d) CXCR5+Th1 cells assessed as proportion of CXCR5+ cells that co-express CXCR3; (e) CXCR5+Th17 cells assessed as proportion of CXCR5+ cells that co-express CCR6; (f) representative FACS plots for regulatory T cells as assessed by Foxp3 and chemokine receptor expression gated on CD4+ T cells in healthy controls (n = 5); (g) Proportion of CCR6+CXCR5+ cells as percentage of CD4+CD45RO+ cells from healthy controls and RA subjects; (h) CXCR5+Th17 cells assessed as proportion of CXCR5+ cells that co-express CCR6 in healthy controls and RA subjects split according to therapy received. For each graph, each dot represents a unique individual in the study, n for groups indicated in Table 1.

