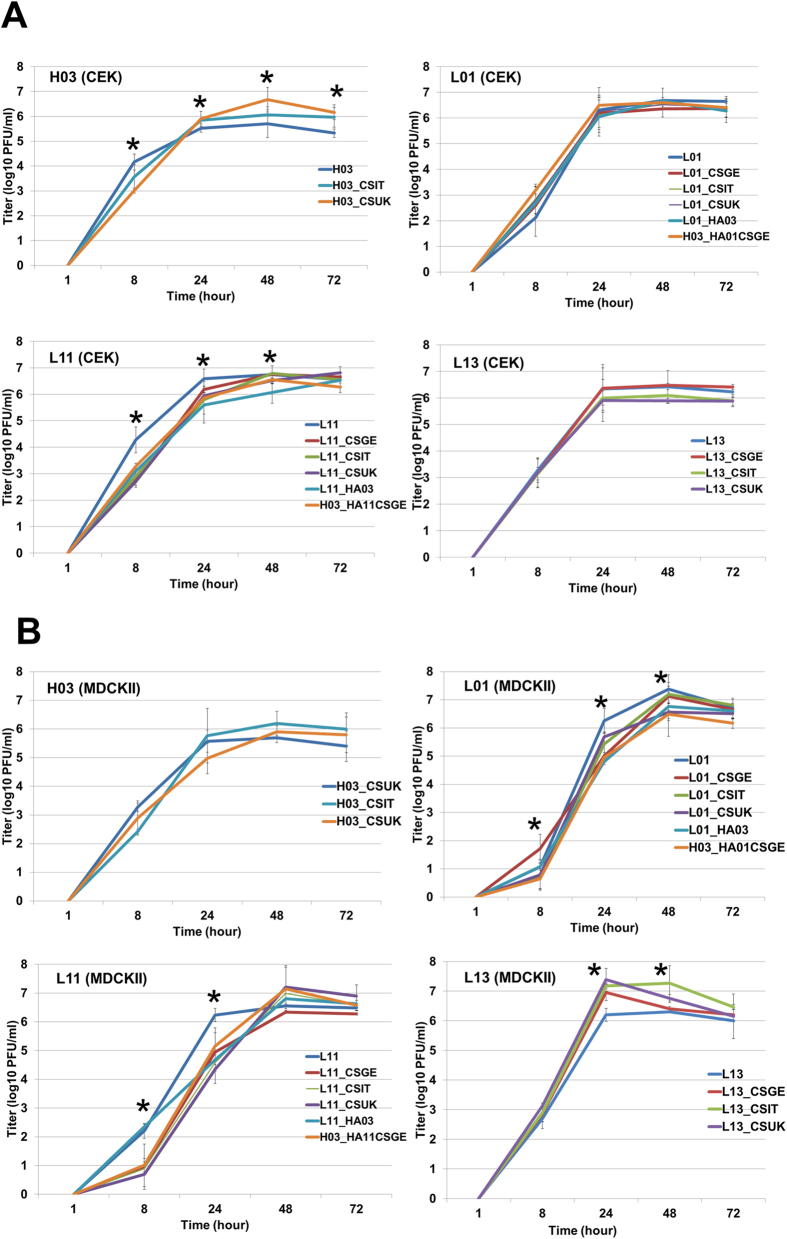
Figure 5.
Replication kinetics of viruses in chicken embryo kidney (A) and Madin-Darby canine kidney cells (B). Shown is the titer (mean ± standard deviation of two independent experiments) of progeny virus at 1, 8, 24, 48 and 72 hours post infection in CEK (A) and MDCKII cells (B). Statistically significant differences are indicated by asterisks (p < 0.05).

