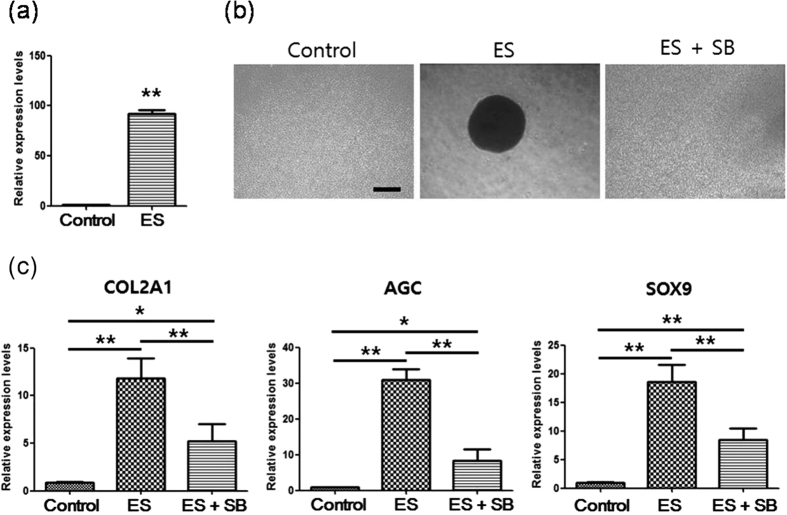
Figure 6. TGF-β signaling mediates MSC condensation and chondrogenesis following ES.
(a) Real-time gene expression analysis of TGF-β1 in micromass cultures of MSCs after culture for 3 days in maintenance medium (control) or with ES (ES); Data are presented as means ± S.D. and differences were identified using Students t-test, **p < 0.01 (b) Effects of SB-431542 (SB) on ES-driven MSC condensation; MSCs in micromass culture were examined using phase contrast images after 3 days culture in maintenance medium (control), with ES (ES), or with ES plus SB-431542 (ES + SB); Scale bars, 500 μm. (c) Effects of SB on ES-induced enhancement of type II collagen (COL2A1), aggrecan (AGC), and Sox9 expression; After 3 days culture in micromass cultures without treatment (control), with ES (ES), or with ES plus SB-431542 (ES + SB), gene expression was analyzed in MSCs using real-time PCR. Data are presented as means ± S.D. Differences were identified using ANOVA; **p < 0.01, *p < 0.05.

