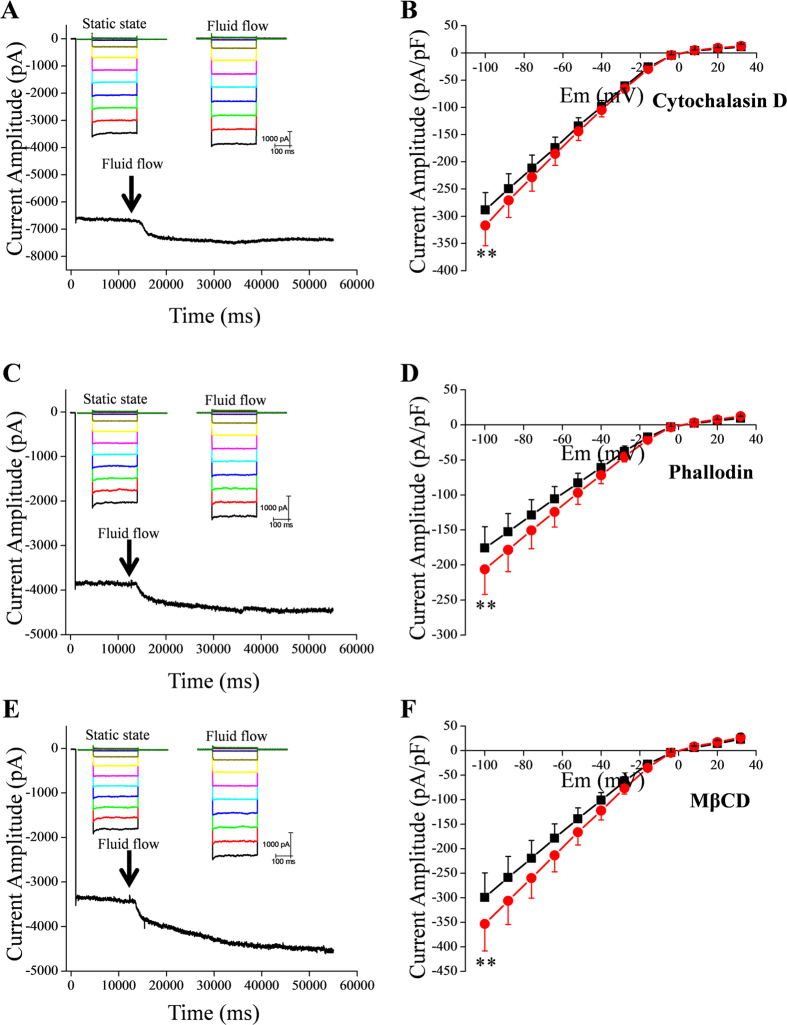
Figure 3. Effects of actin cytoskeleton disruption, stabilization of actin polymers, and disruption of caveolae on fluid flow-induced increase of IKir2.1.
(A,C,E) Representative tracings of IKir2.1 at −100 mV before and after fluid-flow application, recorded from cells pretreated with cytochalasin D (A), phalloidin (C), and MβCD (E). (B,D,F) Summary of the I–V relationships in the absence and presence of fluid flow after pretreatment of cells with cytochalasin D (B), phalloidin (D), and MβCD (F) (n = 8, 8, and 6, respectively); **p < 0.01 vs control.

