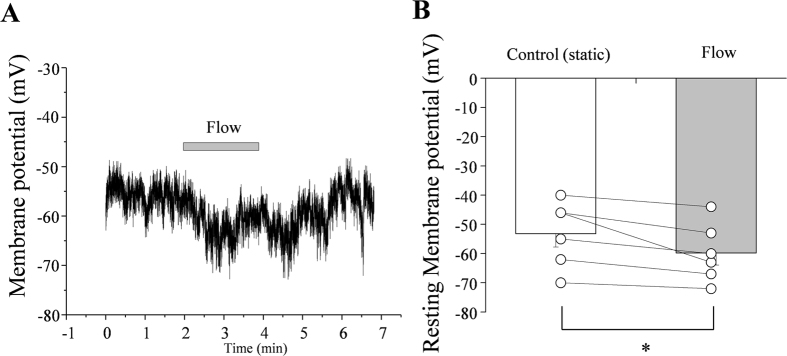
Figure 8. Effect of fluid flow on the membrane potential (Em) of RBL2H3 cells.
(A) Representative tracing of Em showing the effect of fluid flow. (B) Summary of Em values in the absence and presence of fluid flow. Open circles indicate individual points from individual cells. The points from each individual cell under control and flow condition were connected with lines. *p < 0.05 (n = 6).

