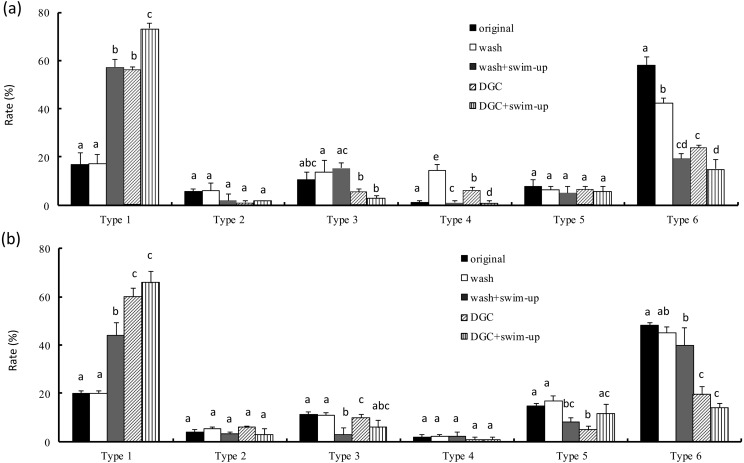
Fig. 4.
Rate of abnormal morphology at the LM level after different four treatments. (a) and (b) indicate the semen data from different fertile men: (a): volunteer A; (b): volunteer B. DGC = Percoll density gradient centrifugation. Wash = original semen washed by HTF. Vertical axis indicates rate of each type of morphology. Type 1 indicates sperm with normal morphology. Type 6 indicates sperm with severe abnormal morphology. a-dDifferent letters in each abnormal type indicate statistically significant differences (P < 0.05) by the Tukey-Kramer method following ANOVA.

