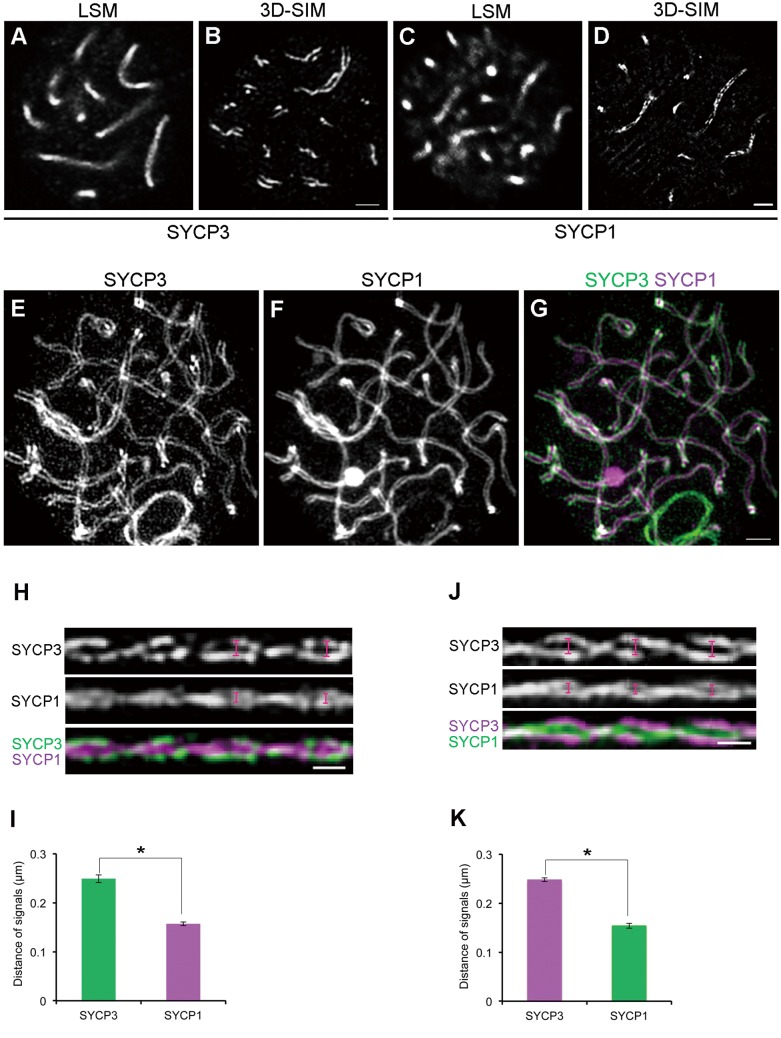
Fig. 1.
Comparison of the resolution power between conventional confocal microscopy and 3D-SIM. (A–D) Mouse spermatocytes at the pachytene stage were immunofluorescently labeled with anti-SYCP3 (A, B) or anti-SYCP1 antibodies (C, D). Subsequently, the signals were observed either by conventional confocal microscopy (LSM) (A, C) or by 3D-SIM (B, D). The nuclei in A and B were from different samples. A single optical section is shown. Scale bars: 1 µm. (E–G). The 3D image of the SC in an entire nucleus of a pachytene spermatocyte was visualized using the “Volume Viewer” function of Priism suite. In the merged image, SYCP3 and SYCP1 signals appear in green and purple, respectively. Scale bar: 1 µm. (H) Linearized SC images from three-dimensional z-stacks obtained by 3D-SIM. The top, middle, and bottom panels show SYCP3, SYCP1, and the merged image (SYCP3 in green and SYCP1 in purple), respectively. Scale bar: 0.5 µm. (I) The average spacing of SYCP3 or SYCP1 (n = 98 homologs, * P < 0.01 by t-test). (J, K) In a similar manner as shown in H and I, the experiments were repeated, exchanging the fluorescent dyes that were conjugated to secondary antibodies. In the merged image, SYCP3 and SYCP1 signals appear in purple and green, respectively. (n = 72 homologs, * P < 0.01 by t-test).

