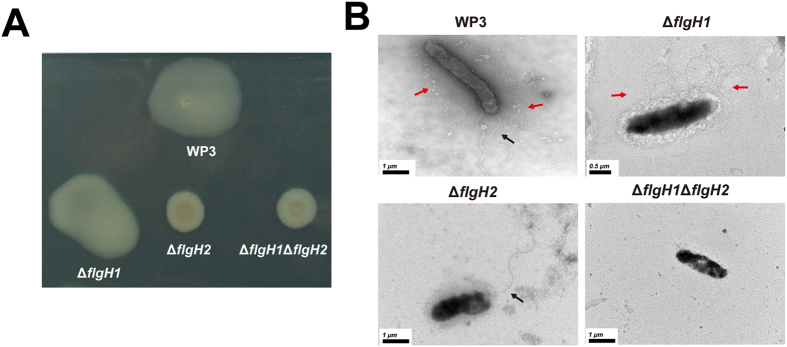
Figure 6. Characterization of the swarming motility and flagellar production of WP3 flagellar gene mutants on agar plates.
(A) Swarming motility assays of the flagellar gene deletion mutants. The results represent at least three independent experiments. (B) TEM analysis of the WP3 flagellar gene mutants that were cultured on a swarming agar plate. The black and red arrows indicate the polar flagellum and lateral flagella, respectively. The scale bars are indicated in the lower-left corner.

