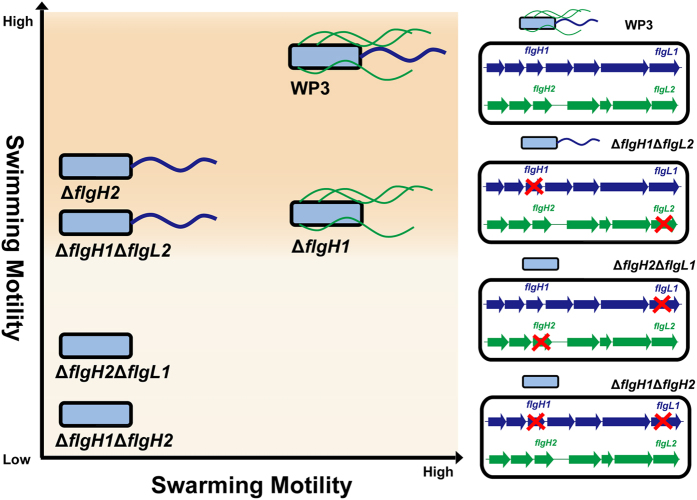
Figure 7. Schematic model of the relationships between the two flagellar systems in WP3.
The X- and Y-axes represent the relative swarming and swimming motility, respectively. The WP3 strains with different genotype are located in the figure according to the results of motility assay and TEM observation. The polar flagellum and lateral flagella are indicated in blue and green colours, respectively. The red crosses indicate the inactivity of related flagellar genes.

