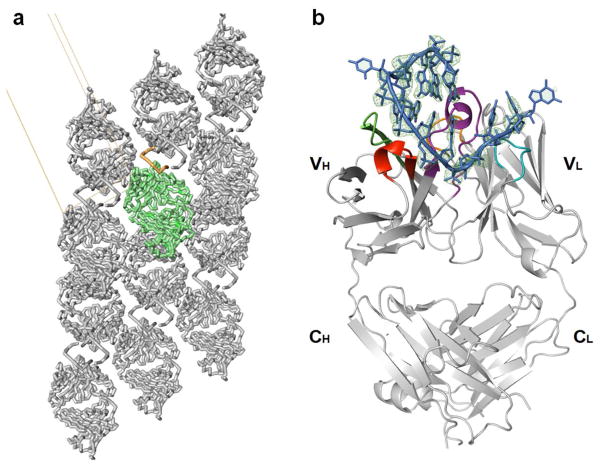
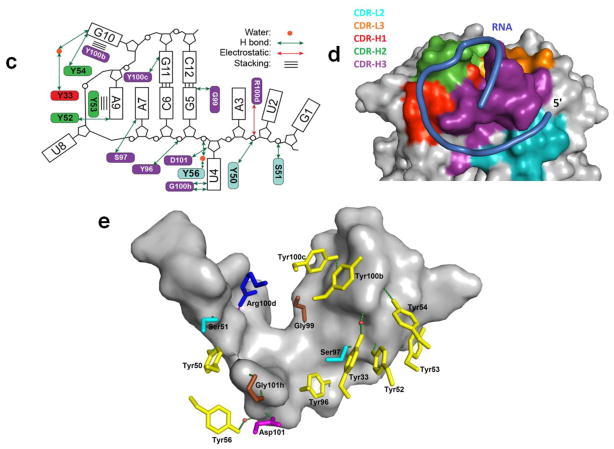
Figure 3.
Crystal structure of the Fab-BRG:R-12 RNA complex. (a). Packing of the Fab-RNA complex (Fab: green; RNA: orange) in the crystal lattice with a unit cell displayed. Symmetry-related molecules are shown in grey. (b). Overall structure of the Fab-RNA complex (Color code: blue – RNA, cyan –CDR-L2, orange – CDR-L3, red – CDR-H1, green – CDR-H2, purple – CDR-H3). RNA is contoured with the |Fobs|-|Fcal| difference map (green mesh, 3.5σ) from a simulated annealing refinement omitting the R-12 RNA. (c). Schematic summary of Fab-RNA interactions on R-12 hairpin. Rectangles represent nucleobases and ovals represent CDR residues colored as in (d). (d). Molecular surface of the Fab-BRG variable domain in complex with the RNA. (e). Interaction between the 12mer RNA and the CDR residues. Orange spheres represent water molecules that mediate hydrogen bonds. Green dashes represent hydrogen bonds, and the red dash represents a salt bridge. Colors correspond to amino acid types (Tyr: yellow, Gly: green, Ser: red, Arg: blue, and others: magenta).


