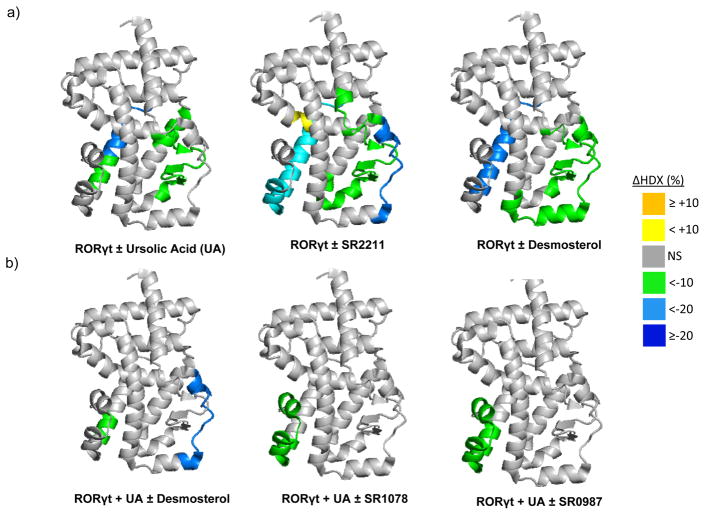
Figure 3. Conformational Dynamics Probed by HDX.
a) Differential HDX kinetics of RORγt LBD ± compounds plotted over the crystal structure PDB:3LOL. b) Differential HDX kinetics of ursolic acid treated RORγt LBD ± compounds plotted over the crystal structure PDB:3LOL. Residues are colored corresponding to the average percent change in deuteration between apo and ligand bound RORγt LBD over 6 time points (10, 30, 60, 300, 900, and 3600 seconds) run in triplicate (n = 3) using the color scale bar shown. Cool colors are increased protection to solvent exchange (increased stabilization) and warm colors are decreased protection to solvent exchange (decreased stabilization). Grey color represents no statistically significant change (NS) observed in this region in HDX data sets comparing apo and ligand-bound receptor as determined using a paired two-tailed student’s t-test (p<0.05).

