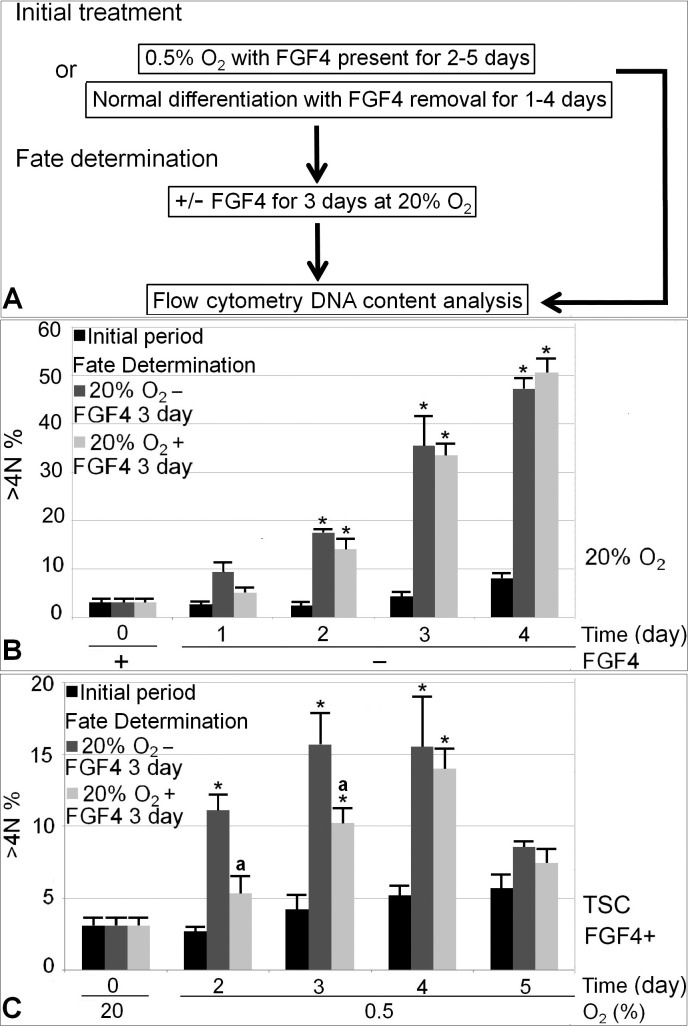
FIG. 6.
Irreversible differentiation happened at 4 days of 0.5% O2 exposure and at 1–2 days in normal differentiation with FGF4 removal. A) Diagram of experimental design. Time in the x-axis indicates the duration of initial normal differentiation (B) or 0.5% O2 (C) treatment. The Y-axis indicates percentage of cells with DNA > 4 N. N represents ploidy. >4 N means cells accumulated more DNA than tetraploidy, thus representing TGC. For each treatment day, there are three columns. The black column on the left represents percentage of cell with DNA > 4 N after initial treatment; the gray column in the middle represents initial treatment plus 3-day fate determination in differentiation conditions; the lighter gray column on the right represents initial treatment plus 3-day fate determination in potency conditions. The first comparison was made between each treatment group with the 0-day control using asterisk (*) to indicate statistical difference (P < 0.05). After every initial treatment day, a second comparison was made between fate determination in potency and differentiation conditions, with letter a indicating statistical difference.

