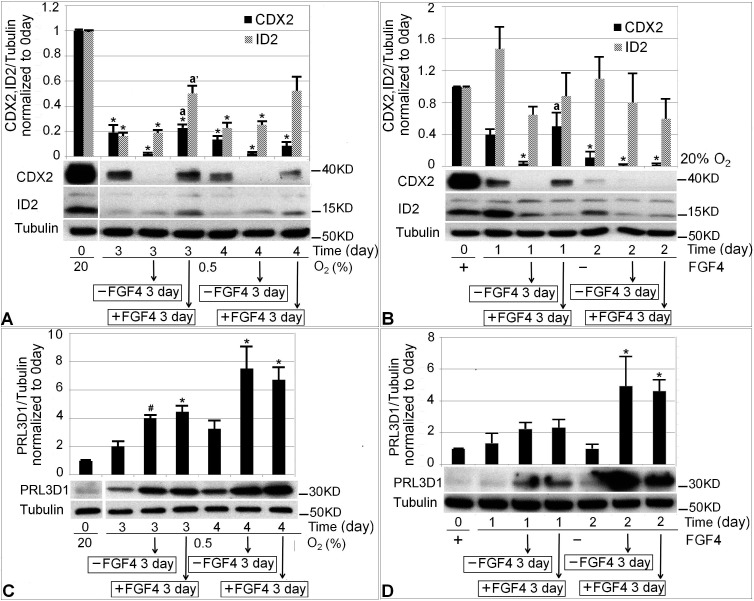
FIG. 7.
Changes in the level of potency (CDX2, ID2) and differentiation (PRL3D1) protein markers after 3 or 4 days of 0.5% O2 treatment or 1 or 2 days of normal differentiation. The first histogram bars in A, B, C, and D show baseline protein level at Day 0. In A, the next three histogram bars following Day 0 form a subgroup showing 3 days of initial 0.5% O2 treatment, 3 days of initial 0.5% O2 plus 3 days of culture in differentiation conditions, and 3 days of initial 0.5% O2 plus 3 days in potency conditions, respectively. The last three histogram bars form another subgroup showing results after 4 days of 0.5% O2 treatment. C) The same experimental design as A, but shows PRL3D1 level. B and D follow the same structure as A and C. The only difference was that the initial treatment was FGF4 removal for 1 or 2 days. The first comparison was made between each treatment group and 0-day baseline using an asterisk (*) to indicate statistical difference (P < 0.05). The second comparison was made between fate determination in potency and differentiation conditions within each subgroup, with letter a indicating statistical difference in CDX2 level, a′ indicating statistical difference in ID2 level. # in C indicates marginal significant PRL3D1 increase compared with 0 days (P = 0.058).

